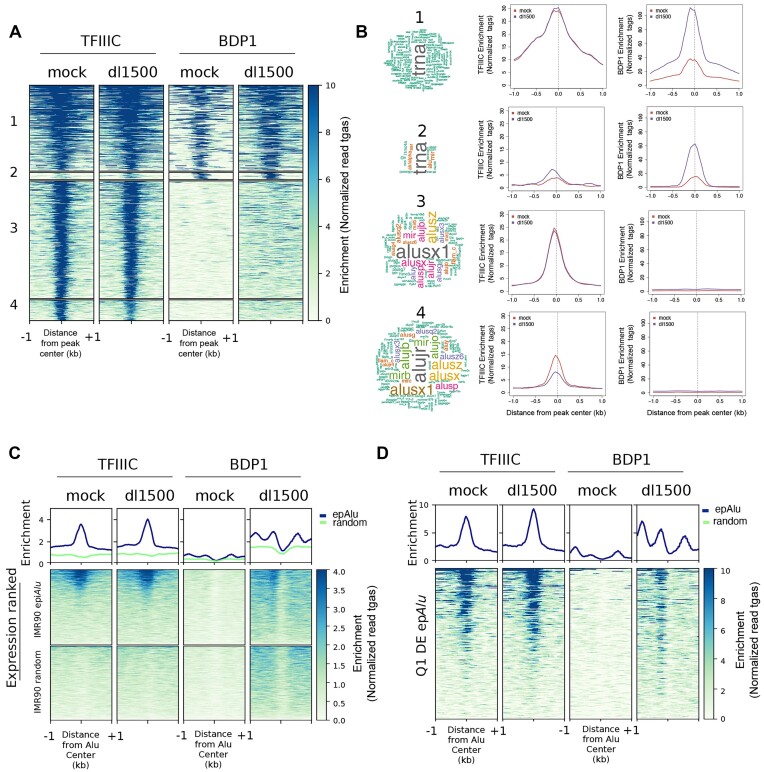
Figure 2.
Genome-wide location analysis of TFIIIC and TFIIIB in the presence/absence of e1a. (A) Heatmap of TFIIIC (GTF3C2) and Bdp1 spanning ±1 kb across all TFIIIC-bound sites in mock- and dl1500-infected cells. Clusters 1 to 4 were created by combinatorial clustering of the two factors across all regions bound. Color bar scale with increasing shades of color stands for increasing enrichment (normalized read tags). (B) Shown on the left is the word cloud analysis of repetitive elements associated with regions occupied by TFIIIC and Bdp1 in the four clusters. Font size reflects enrichment for the indicated term. Reported on the right are the results of sitepro analysis (120) of TFIIIC and Bdp1 enrichment (normalized read tags) for each cluster reported in panel A. Enrichment is shown spanning 2 kb from the center of the peaks. (C) Shown in the upper part of the panel are the average ChIP-seq enrichment profiles (normalized read tags) of the TFIIIC 110 kDa subunit (left) or the Bdp1 component of TFIIIB (right) in either mock-infected or dl1500-infected IMR90 cells across the 1805 epAlus and across random Alus. Reported below the plots are heatmaps of TFIIIC and Bdp1 enrichment at the same Alus, sorted according to their expression level in dl1500-infected cells (top, high expression; bottom, low expression). (D) Enrichment profiles (normalized read tags) of TFIIIC and Bdp1, in either mock-infected or dl1500-infected IMR90 cells, at differentially expressed Alus whose expression levels in the presence of e1a falls in the first quartile (Q1 DE epAlu), sorted according to their expression level in dl1500-infected cells (top, high expression; bottom, low expression).

