
Figure 1.
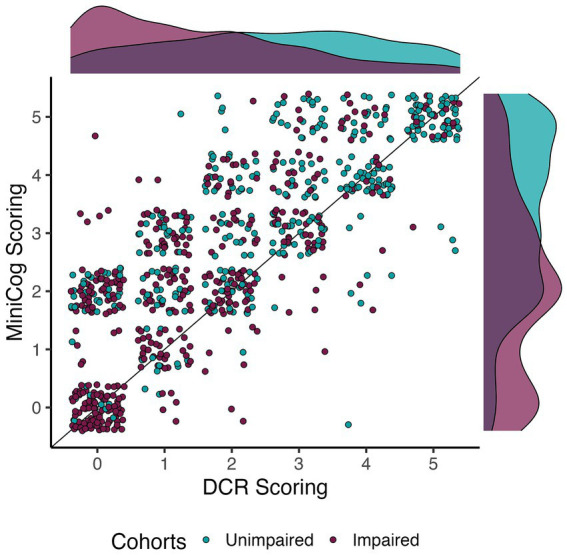
Relationship between DCR and Mini-Cog scoring per cohort. Dots are jittered to facilitate visualization of score prevalence. The apparent correlation between scores was confirmed by a significant and moderate Kendall’s Tau correlation (τB = 0.71, p < 0.0001). Note that DCR tended to score impaired individuals quite low relative to the Mini-Cog.