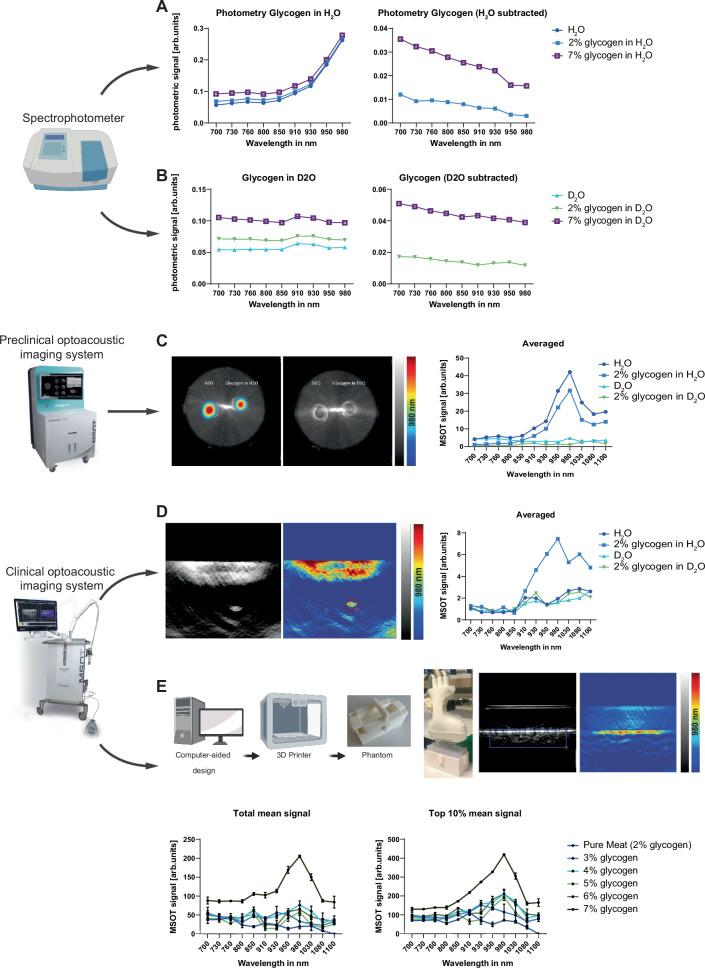
Fig. 1. Multimodal derivation of spectral information for glycogen reveals specific signatures for clinical imaging.
A Photometric absorption spectra between 700 and 980 nm for pure H2O, and H2O with 2% and 7% glycogen, respectively (left). Photometric absorption spectra with subtracted H2O background (right). B Photometric absorption spectra between 700 and 980 nm for pure D2O, and D2O with 2% and 7% glycogen, respectively (left). Photometric absorption spectra with subtracted D2O background (right). C Averaged optoacoustic signal in the preclinical imaging system from 700 to 1100 nm for pure H2O, pure D2O, and 2% glycogen in H2O and D2O, respectively. D Averaged optoacoustic signal in the clinical imaging system from 700 to 1100 nm for pure H2O, pure D2O, and 2% glycogen in H2O and D2O, respectively. E Averaged optoacoustic signal in the clinical imaging system from 700 to 1100 nm for pure minced meat and minced meat of the same origin with increasing glycogen concentrations. Values are given as mean values of scan data with negative signal intensities set to 0 or given as mean values of the top 10% of signal intensities per scan. The data represent one of two independent experiments with similar results. This figure was created with BioRender.com released under a Creative Commons Attribution-NonCommercial-NoDerivs 4.0 International license.

