
Figure 4.
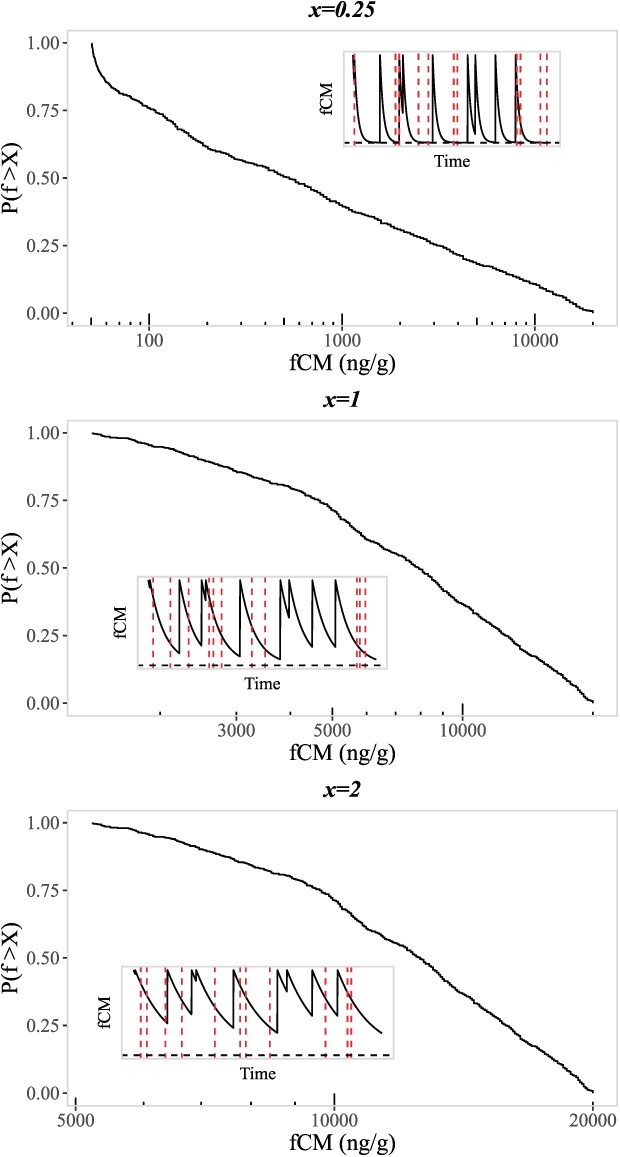
Example curves of GC dynamics (insets) for faecal corticosterone metabolite (fCM) levels given random timing of spikes. Spikes represent elevation of fCM levels, followed by exponential decay of fCM levels. Resulting cumulative distributions are shown given random sampling along the curves of GC dynamics (sampling illustrated via vertical red, dashed lines). GC dynamics and cumulative distributions are shown for three values of model parameter x: x < 1 indicates fCM spike frequency is lower than the rate of fCM decay, x = 1 indicates these rates are equal, and x > 1 indicates fCM spikes are more frequent than the rate of fCM decay.