. 2024 Sep 6;12(9):e009603. doi: 10.1136/jitc-2024-009603

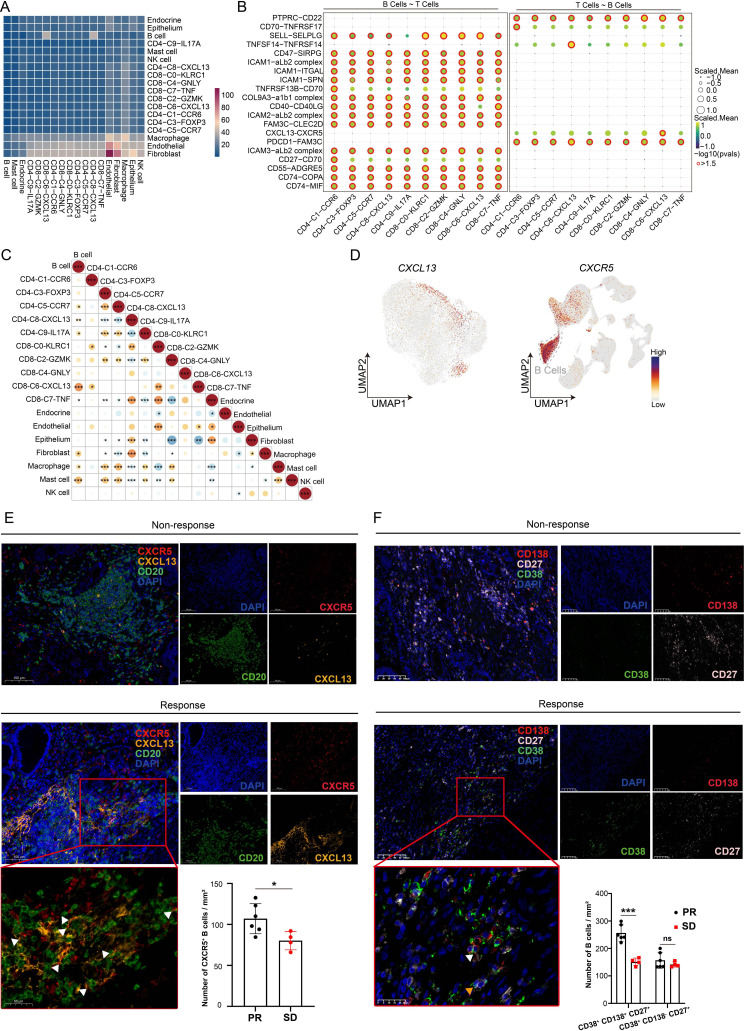
Figure 4. CXCL13+ CD160+ CD8+ T cells communicated with B cells through CXCL13-CXCR5 interactions. (A) Correlation heatmap between various immune subset enrichments using the bulk RNA-seq of gastric cancer samples from TCGA cohort. (B) Bubble heatmap showing cell–cell communication inference between T-cell clusters and B cells through ligand and receptor binding. (C) Analyzing the correlation between different types of immune cells based on the integrated scRNA-seq data sets. (D) UMAP plot displaying the expression of CXCL13 in T cells and the expression of CXCR5 among all cell types. (E) Multiplex immunofluorescence experiments were performed to detect the degree of CXCR5+ B-cell infiltration around TLSs in patients with different responses following immunotherapy. Antibody panel: CXCL13 (orange), CXCR5 (red), CD20 (green), Scale bar, 100 µm. The framed areas are shown below at a higher magnification. White triangles indicated CXCR5+ B cells. The number of infiltrating CXCR5+ B cells in patients with different responses was statistically analyzed. (F) Multiplex immunofluorescence images showing the markers for CD38 (green), CD138 (red), CD27 (white) and DAPI. Scale bar, 100 µm. The framed areas are shown below at a higher magnification. White triangle indicated CD38+ CD138+ CD27+ B cells; yellow triangle indicated CD38+ CD138 CD27+ B cells. The number of infiltrating CD38+ CD138+ CD27+ B cells and CD38+ CD138 CD27+ B cells in patients with different responses was statistically analyzed. Data are presented as the mean±SD. ns, not significant. *p<0.05, ***p<0.001, two-tailed Student’s t-test. DAPI, 4’, 6-diamidino-2-phenylindole; PR, partial response; SD, stable disease; scRNA-seq, single-cell RNA sequencing; TCGA, The Cancer Genome Atlas; UMAP, Uniform Manifold Approximation and Projection.

Figure 4