. 2024 Sep 6;12(9):e009603. doi: 10.1136/jitc-2024-009603

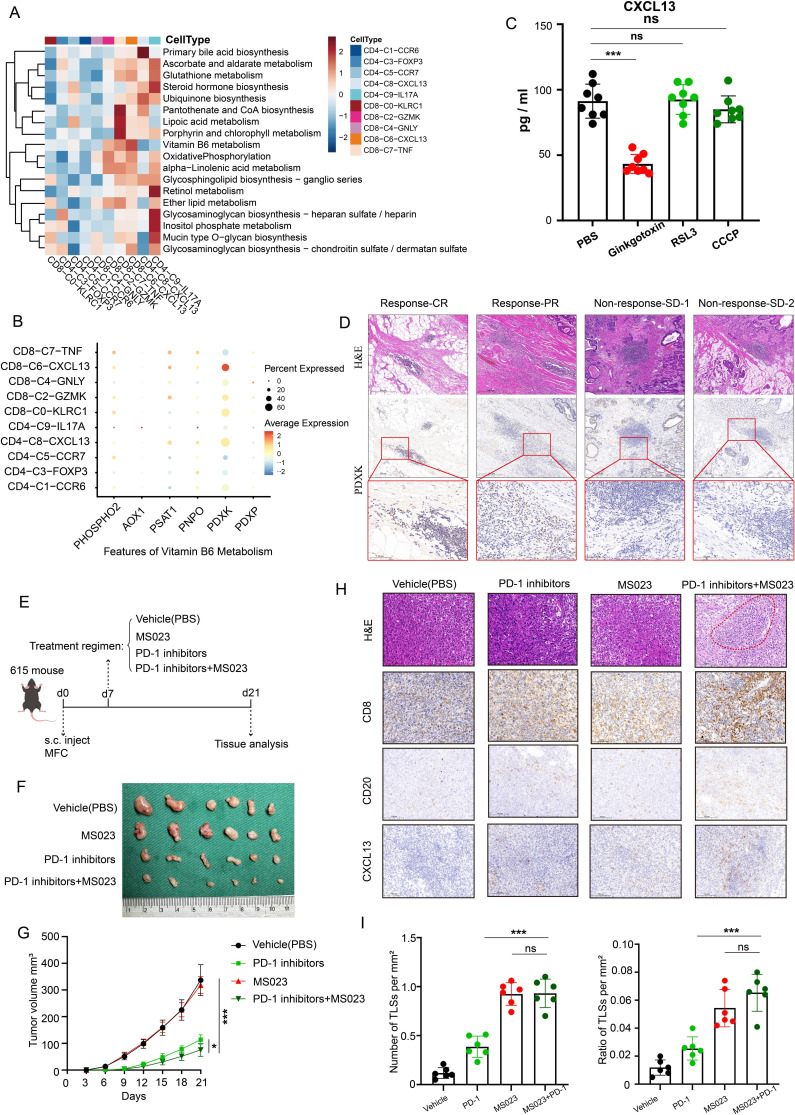
Figure 5. Targeting PDXK could promote the formation of TLSs and enhance the efficacy of immunotherapy in gastric cancer. (A) Heatmap displaying the metabolic feature for T-cell clusters using scMetabolism package. (B) Dot plot showing the expression of the genes encoding rate-limiting enzymes of vitamin B6 metabolism in different types of T cells. Dot size encodes the percentage of cells expressing the gene, color encodes the average per cell gene expression level. (C) Quantification of CXCL13 in PDTFs in the presence of different enzyme inhibitors measured by ELISA. (D) Representative H&E staining and PDXK immunohistochemistry of gastric cancer tissues with different responses following immunotherapy. Scale bar, 500 µm. (E) The schematic diagram of the animal experiments. (F–G) Images of tumors and tumor volume curves of 615 mice treated with various agents (n=6, each group). (H) Paraffin sections of mouse subcutaneous graft tumor tissue stained with H&E and IHC detection for CD8, CD20 and CXCL13. Scale bar, 100 µm. (I) The number (left panel) and area (right panel) of TLS per tumor area were compared between groups (n=6, each group). Data are presented as the mean±SD. ns, not significant. *p<0.05, ***p<0.001, two-tailed Student’s t-test. AOX1, aldehyde oxidase 1; CCCP, carbonyl cyanide m-chlorophenyl hydrazone; CR, complete response; MFC, mouse forestomach carcinoma; PBS, phosphate-buffered saline; PDXK, pyridoxal kinase; PDXP, pyridoxal phosphatase; PDTFs, patient-derived tumor fragments; PHOSPHO2, phosphatase orphan 2; PNPO, pyridoxamine 5'-phosphate oxidase; PR, partial response; PSAT1, phosphoserine aminotransferase 1; s.c, subcutaneous injections; SD, stable disease; TLS, tertiary lymphoid structures.

Figure 5