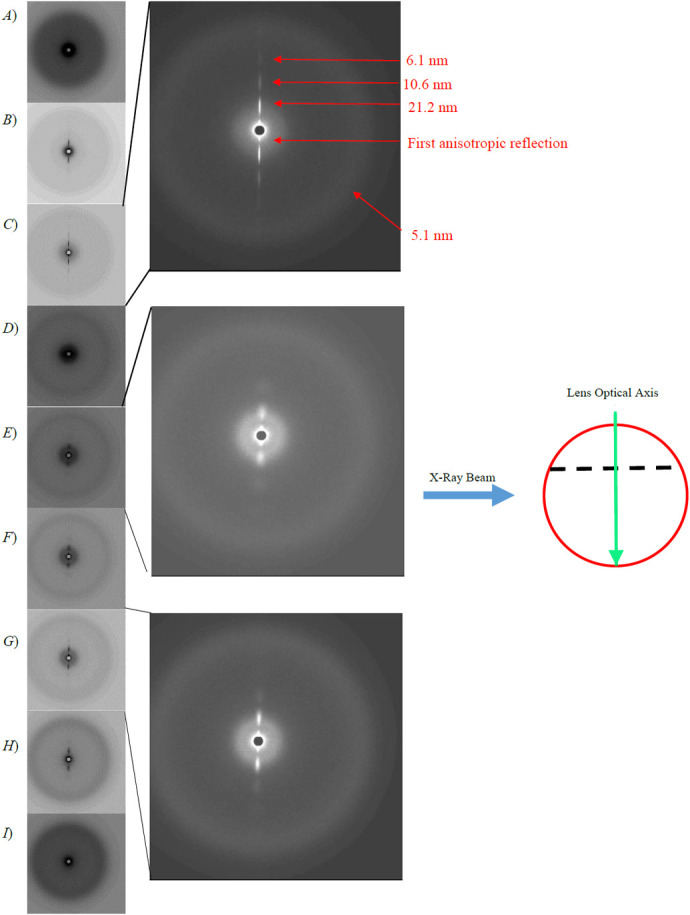
Fig. 1.

A series of X-ray diffraction patterns summarising the one-dimensional scan A of a whole squid lens. Each individual pattern represents 1 mm along the length of the scan. Panels A to C are from the anterior segment, D is from the septum and E-I are from the posterior segment. Expanded images of Figures 1 (C), (E) and (G) with inverted grey scales are also shown for clarity. The schematic diagram shows a side view of a whole squid lens (red circle) the dotted line represents the septum, in relation to the optical axis of the lens (green area) and the direction of the X-ray beam (blue arrow) in this scan.
