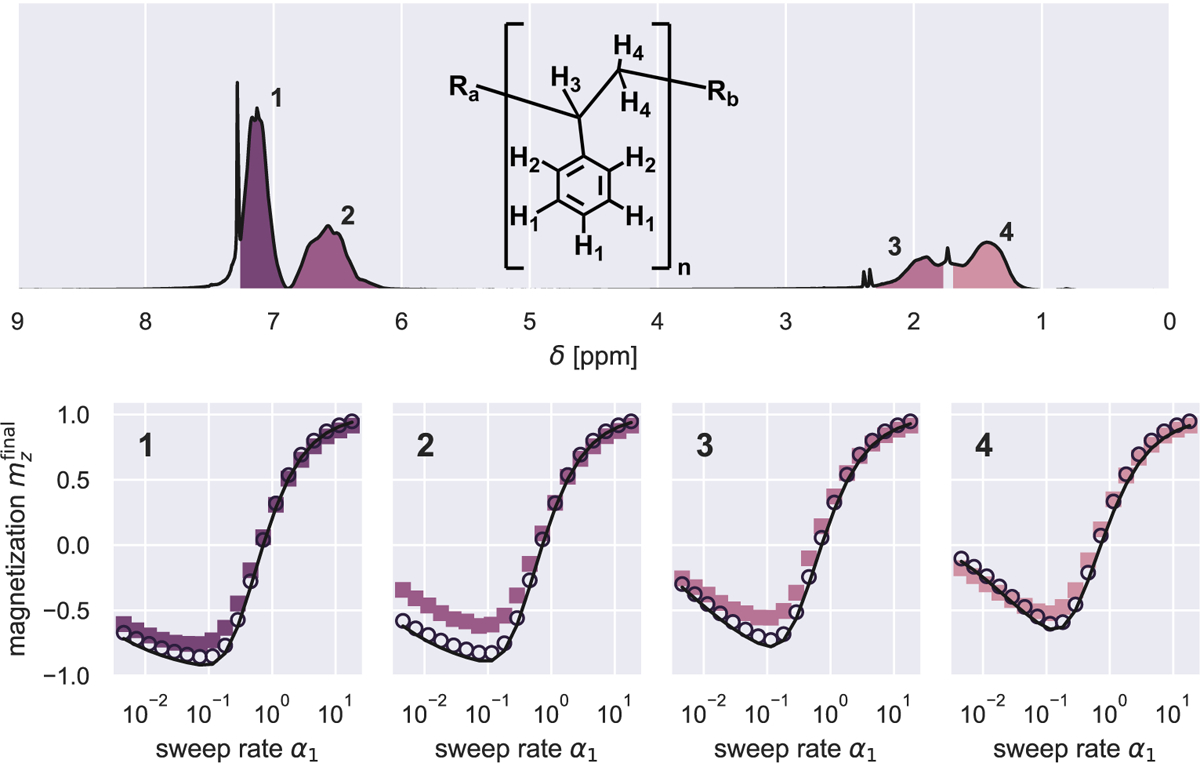
Figure 5:

Experimental measurement of final magnetization after a sweep through resonance. Top: Solution NMR of 200k polystyrene in at and 500 MHz. The integrated NMR peaks used in the analysis are numbered and shaded in purple. Bottom: Final magnetization after a chirped pulse plotted . the sweep-rate parameter for the four numbered resonances (sweep rate , sweep time ). Colored squares are experimental data, black circles are numerical simulations, and black lines are eq. 63.
