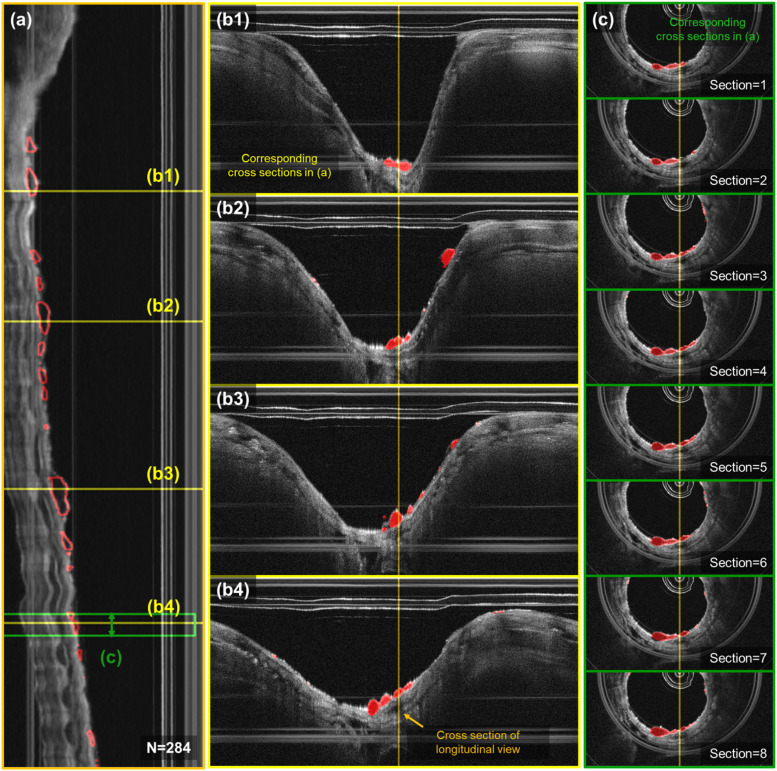
FIG. 6.
Localization of airway sloughing in a 3D OCT scan of the airway. (a) Longitudinal cross section of the airway of a sample rabbit after 30 mins of chlorine gas exposure. (b1)–(b4) Representative results of localization of bubbles from the trained network in unwrapped images that correspond to the yellow lines in (a). (c) Visualization of bubble localization in 8 sequential cross sections corresponding to the green colored box regions in (a).

