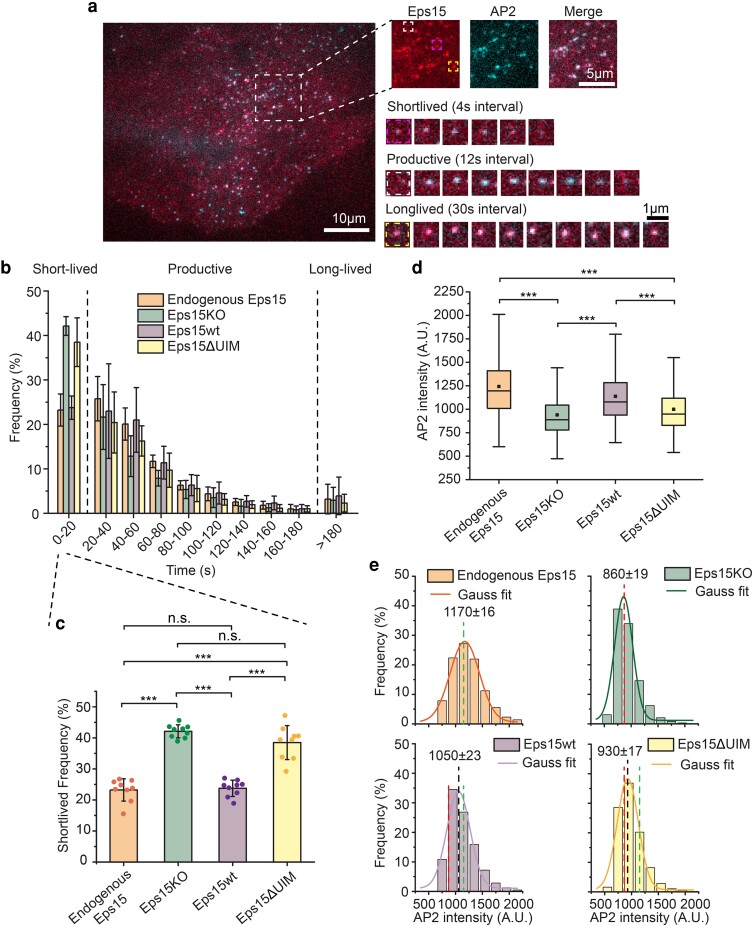
Fig. 2.
Eps15 knockout creates a significant defect in coated pit dynamics that cannot be rescued by a version of Eps15 that lacks the UIM. a) Representative image of a SUM cell expressing gene-edited AP-2 σ2-HaloTag: JF646 and Eps15-mCherry. Large inset highlights three representative clathrin-coated structures shown in smaller insets: short-lived, productive and long-lived structures lasting 20 s, 96 s and > 5 min, respectively. Scale bars are labeled in the images. b) Histograms of lifetime distributions of clathrin-coated structures under different experimental groups. Endogenous Eps15 represents SUM cells that have endogenous Eps15 expression. Lifetime shorter than 20 s is considered short-lived, lifetime between 20 and 180 s is labeled as productive and structures lasting longer than 180 s are long-lived. Eps15KO represents SUM cells that were CRISPR modified to knockout alleles of endogenous Eps15. Eps15wt and Eps15ΔUIM represent Eps15KO cells transfected with wild-type Eps15 and Eps15 with the depletion of both UIM domains, respectively. mCherry was fused to the C terminus of Eps15 and Eps15ΔUIM for visualization. c) Bar chart of the short-lived fraction for each group from b, error bars are standard deviation, dots represent the results from different cells. d) Box plot of endocytic pits AP2 intensity in all four groups. e) Histograms and the Gaussian fit of the AP2 intensity distribution tracked in endocytic pits under different experimental groups. Green dotted line indicates the peak distribution in Endogenous Eps15 cells, and red dotted line indicates the peak distribution in Eps15KO cells. For the Endogenous Eps15 group, n = 9 biologically independent cell samples were collected and in total 4,346 pits were analyzed. For Eps15KO, n = 9 and 8,195 pits. Eps15wt, n = 9 and 4,387 pits and Eps15ΔUIM, n = 9, 6,779 pits. An unpaired, two-tailed Student's t-test was used for statistical significance. n.s. means no significant difference. ***P < 0.001. All cell images were collected at 37°C.

