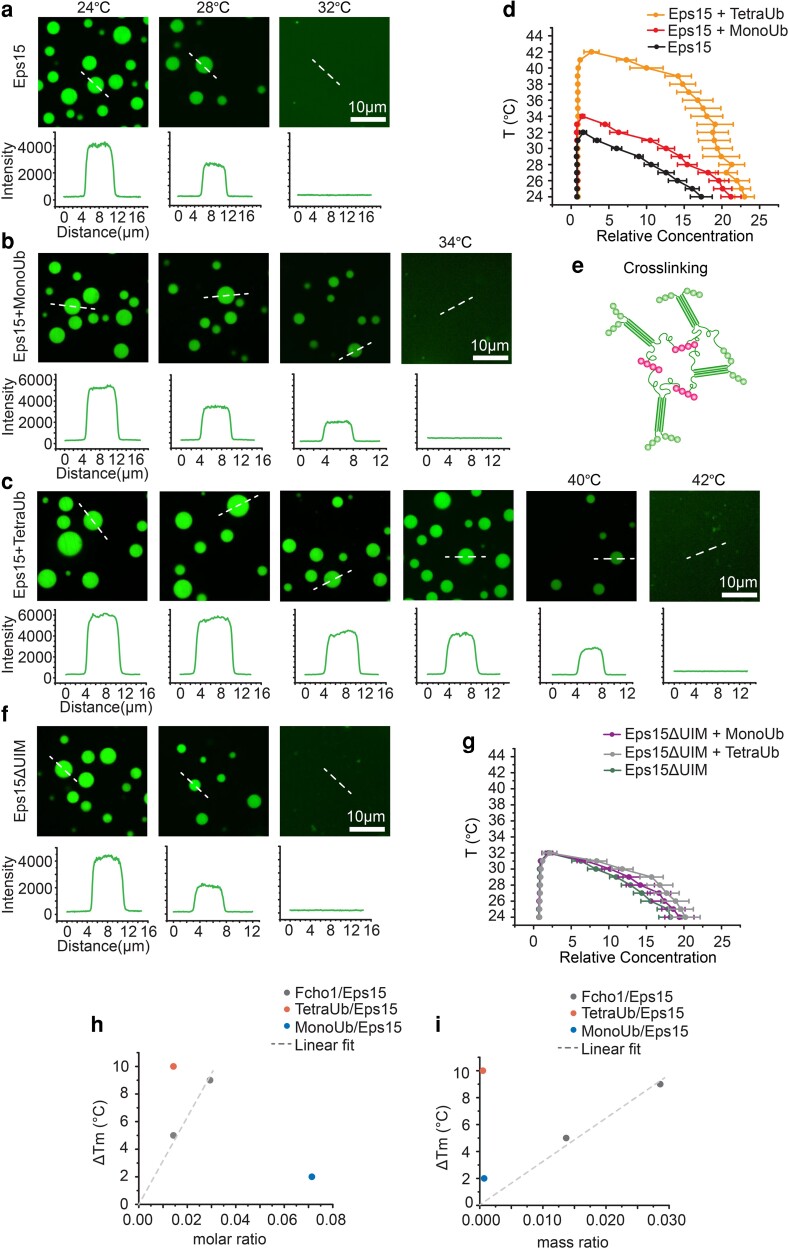
Fig. 3.
Polyubiquitin elevates the melting temperature of liquid-like Eps15 networks. a–c, f) Representative images of protein droplets at increasing temperatures. Plots show fluorescence intensity of Eps15 measured along dotted lines in each image. Droplets are formed from (a) 7 μM Eps15, (b) 0.5 μM MonoUb, 7 μM Eps15, (c) 0.1 μM TetraUb, 7 μM Eps15 and (f) 7 μM Eps15ΔUIM in 20 mM Tris–HCl, 150 mM NaCl, 5 mM TCEP, 1 mM EDTA and 1 mM EGTA at pH 7.5 buffer with 3% PEG8000. d, g) Phase diagram of Eps15/monoUb/TetraUb (d) and Eps15ΔUIM/MonoUb/TetraUb (g) droplets mapped by Atto488-labelled Eps15/Eps15ΔUIM fluorescence intensity. Intensity was normalized based on the intensity of the solution. Dots on the right side are protein concentrations in droplets and dots on the left side are concentrations in solution. At least 20 droplets are analyzed under each temperature. Data are mean ± SD. Scale bars equal 10 μm. e) Schematic of polyubiquitin cross-linking and stablizing Eps15 network. h, i) the change in the melting temperature of Eps15 droplets upon the addition of MonoUb, TetraUb and Fcho1 of different molar ratio (h) and mass ratio (i). Fcho data were adopted from previous work (12), dash line is the linear fit of Fcho data points.

