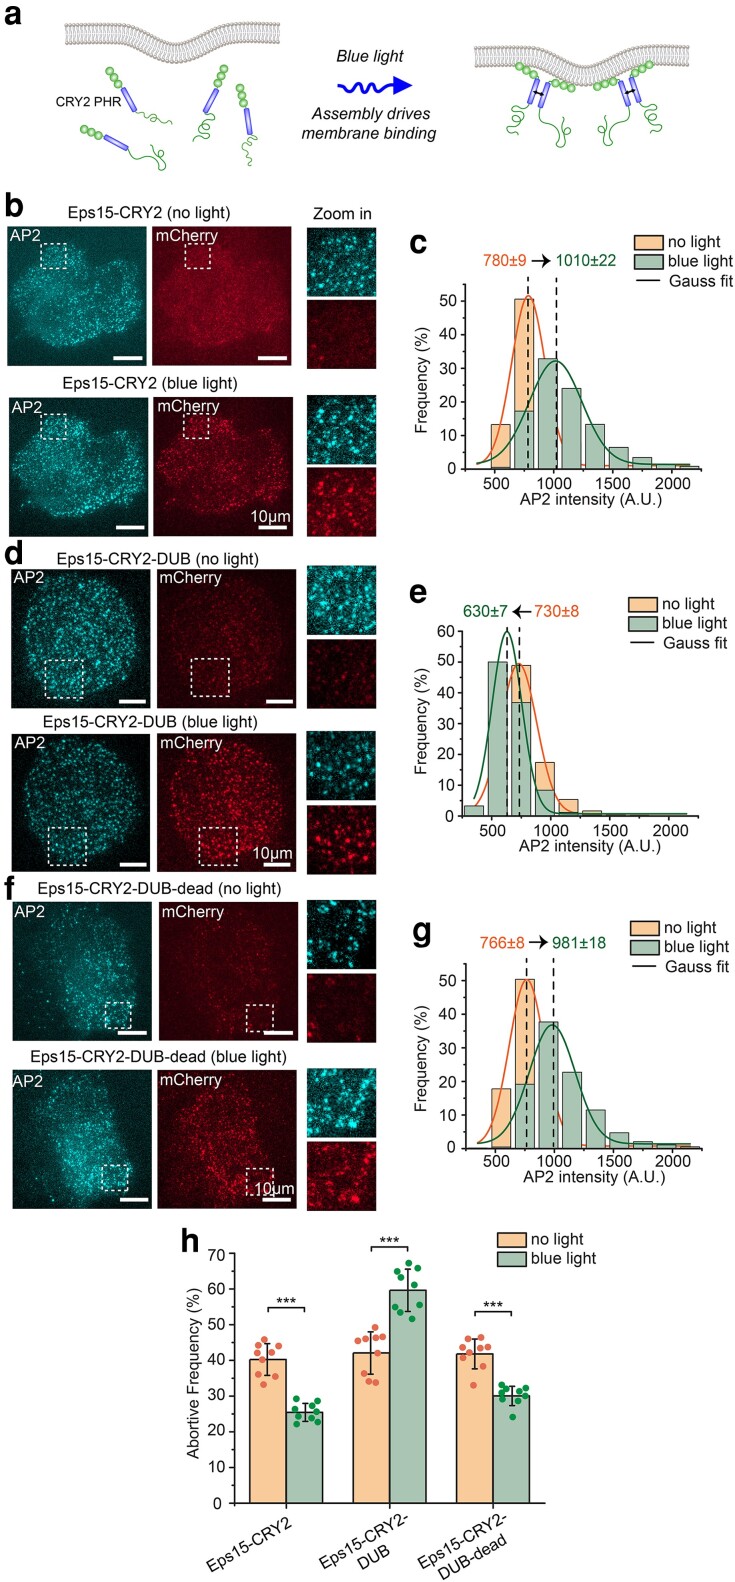
Fig. 6.
Light-activated recruitment of DUBs demonstrates that loss of ubiquitination destabilizes endocytic sites within minutes. a) Schematic of blue light driving assembly and membrane binding of Eps15-CRY2 chimera in which the Eps15 coiled-coil domain is replaced with the light-activation CRY2 PHR domain. b, d, f) Representative images of Eps15KO SUM cells expressing Eps15-CRY2 (b), Eps15-CRY2-DUB (d), and Eps15-CRY2-DUB-dead (f) before and after applying blue light. AP-2 σ2-HaloTag was labeled with JF646. Insets show the zoom-in area of the white dashed box. mCherry was fused to all three constructs at their C terminus for visualization. Scale bar = 10 μm. c, e, g) Histograms and the Gaussian fit of the AP2 intensity distribution tracked in endocytic pits when expressing Eps15-CRY2 (c), Eps15-CRY2-DUB (e) and Eps15-CRY2-DUB-dead (g) before and after exposed to blue light, respectively. h) Frequency of short-lived structures comparison before and after blue light was applied to the cells under each condition. For Eps15-CYR2, n = 9 biologically independent cell samples were collected and in total 7,539 pits (before light) and 7,616 pits (blue light) were analyzed. For Eps15-CRY2-DUB, n = 9 and 7,533 pits (before light) and 6,626 pits (blue light) were analyzed. For Eps15-CRY2-DUB-dead, n = 9 and total pits = 8,114 (before light) and 8,514 (blue light). Dots represent frequency from each sample. An unpaired, two-tailed Student's t-test was used for statistical significance. ***P < 0.001. Error bars represent standard deviation. Cells were imaged at 37°C for all conditions.

