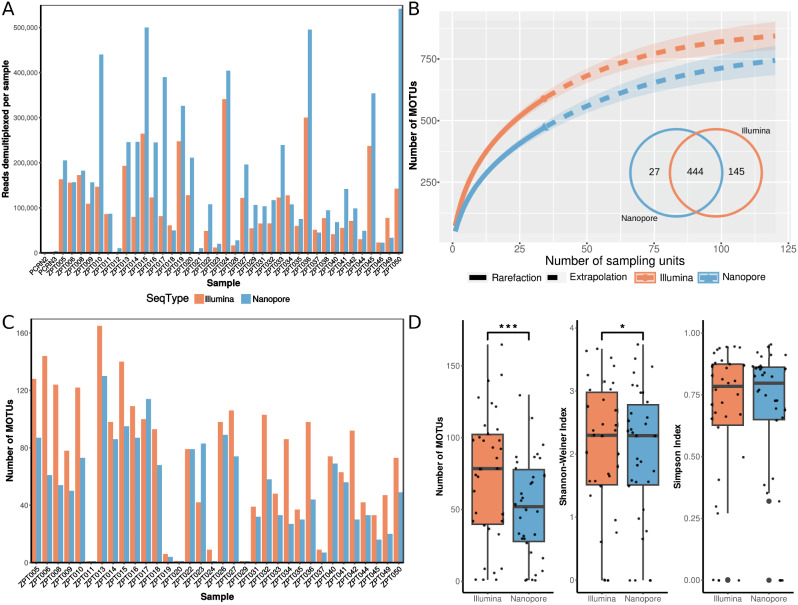
Fig. 1.
Sequencing statistics of zooplankton metabarcoding with Illumina MiSeq and Nanopore MinION. (a) Bar plot of sequence reads demultiplexed per sample per sequencing dataset. (b) Species accumulation curves of molecular operational taxonomic unit (MOTU) richness for each sequencing platform against the number of samples, extrapolated to visualise number of samples needed to capture maximum richness; number of MOTUs obtained (and shared) expressed in Venn (insert). (c) Bar plots showing the number of MOTUs obtained per sample per sequencing type. (d) Box plots comparing MOTU richness, Simpson index, and Shannon-Weiner index between sequencing platforms; asterisks indicate significant differences for paired Wilcoxon signed-rank tests, and dots represent individual sample points (jittered)

