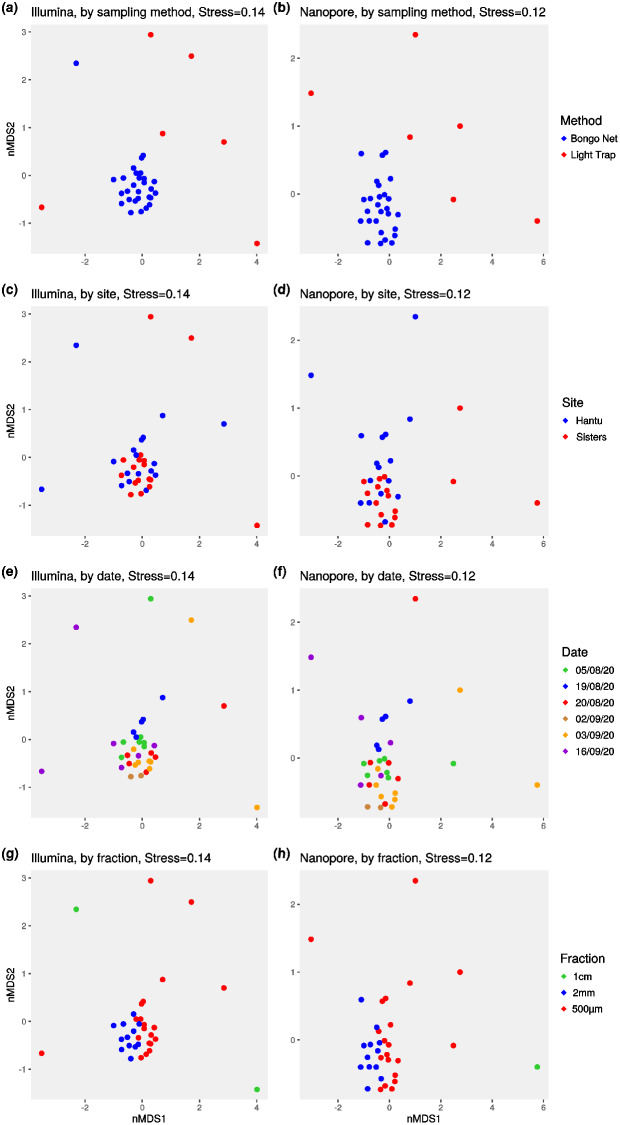
Fig. 2.
Two-dimensional nonmetric multidimensional scaling (nMDS) plots based on normalised Bray-Curtis distances for Illumina (a, c, e, g), and nanopore (b, d, f, h); coloured by sampling method (a and b), sampling site (c and d), date (e and f), and size fraction (g and h). ZPT024 was removed from the nanopore dataset to better visualise the spread of points; it was similarly distinct from the remaining samples for both sequencing types

