Fig. 1.
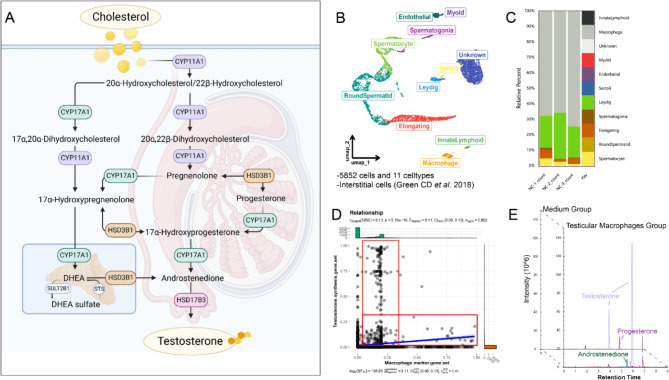
TM and Testosterone Synthesis Genes. A: A schematic representation of the complete pathway for de novo testosterone synthesis; B: A UMAP plot showing the distribution of different cell clusters in the testis, with each colored dot representing a cell; C: The estimated proportions of various cell types following deconvolution analysis of transcriptomic sequencing from three groups of TM; D: A scatter plot illustrating the correlation analysis results after scoring each cell for two gene sets; E: The results from targeted steroid hormone metabolomics revealed the levels of various steroid hormones in macrophage culture medium and in control blank culture medium

