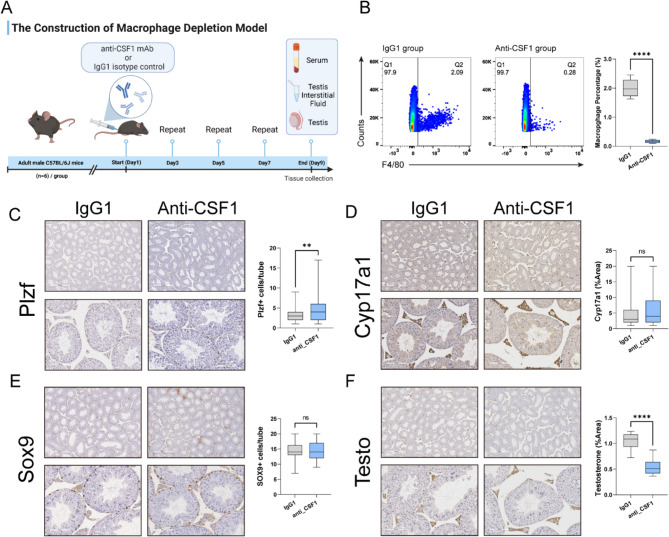
Fig. 5.
Construction and Validation of Macrophage Depletion Mouse Model. A: Schematic diagram of the construction of the testicular macrophage depletion model in mice; B: Flow cytometry validation of the proportion of F4/80 positive cells in the total testis of macrophage-depleted mice compared to control mice; C, D, E, F: Immunohistochemical analysis showing changes in spermatogonial stem cells (Plzf), Interstitial cells (Cyp17a1), Sertoli cells (Sox9), and Testosterone after macrophage depletion, with bar graphs summarizing the results of the immunohistochemical analysis

