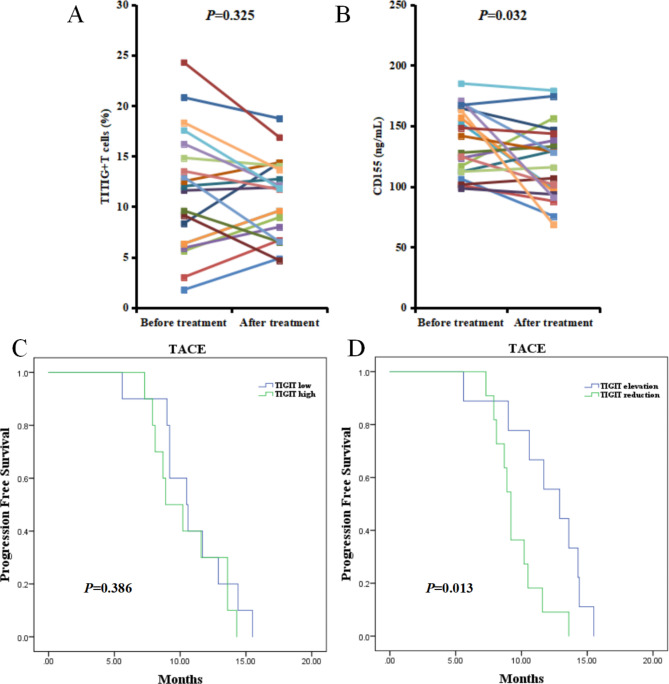
Fig. 1.
A, Changes in the proportion of TIGIT + T cells before and after TACE treatment. B, Changes in CD155 expression in the plasma before and after TACE treatment. C, PFS rates of patients in the TIGIT high- and low-expression groups who received TACE treatment alone. D, PFS rates in patients with increased and decreased TIGIT expression after TACE treatment
TACE: transcatheter arterial chemoembolization; TIGIT: T-cell immunoreceptor with immunoglobulin and immunoreceptor tyrosine-based inhibitory motif domains; PFS: progression-free survival

