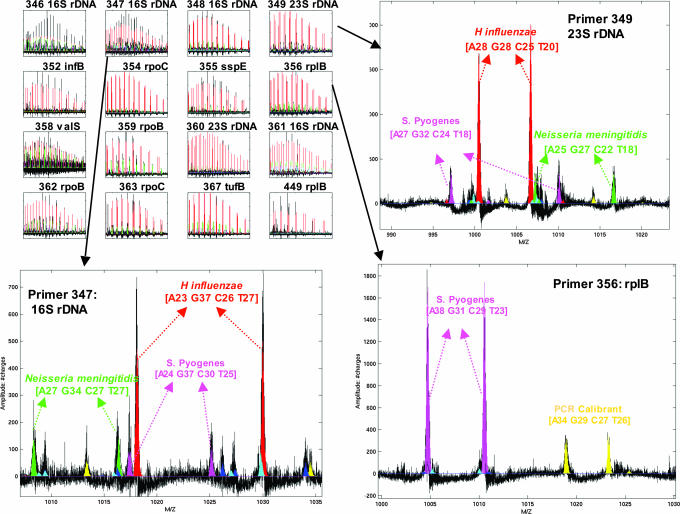
Fig. 1.
Mass spectra from DNA amplified from a throat swab (Table 3, sample 5) using each of the 16 surveillance primers (Table 1). (Upper Left) Thumbnail spectra from 16 primers. Each of the PCR wells was calibrated by using an internal standard identical to the bacterial target sequence except for a 2- to 5-nt internal deletion (calibrant peaks are shown in yellow). (Upper Right) Spectrum from a primer pair that targets 23S rDNA. The paired peaks correspond to the sense and antisense strands of the PCR amplicon that are separated under conditions of ionization. The peaks are labeled with base composition of the amplicons and the organism that matches the composition. (Lower Left) Spectrum from a primer pair that targets 16S rDNA. (Lower Right) Spectrum from a primer pair that targets the Bacilli, but not the Proteobacteria.

