Figure 4.
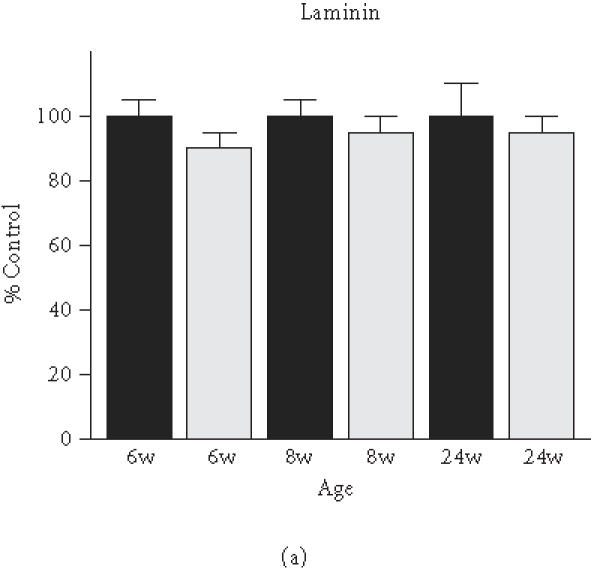
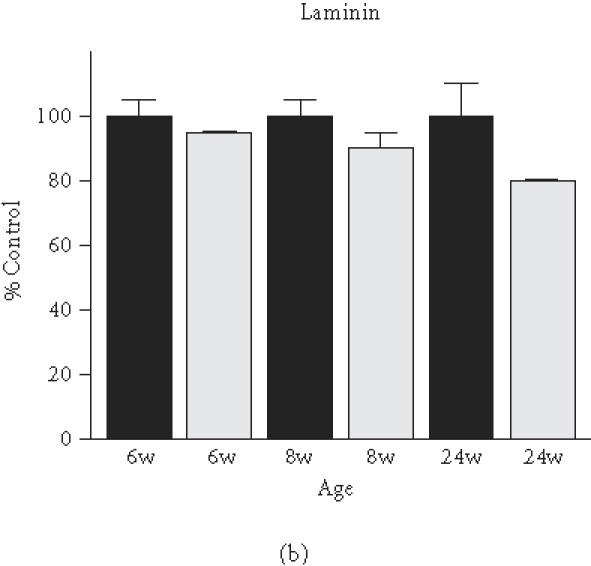
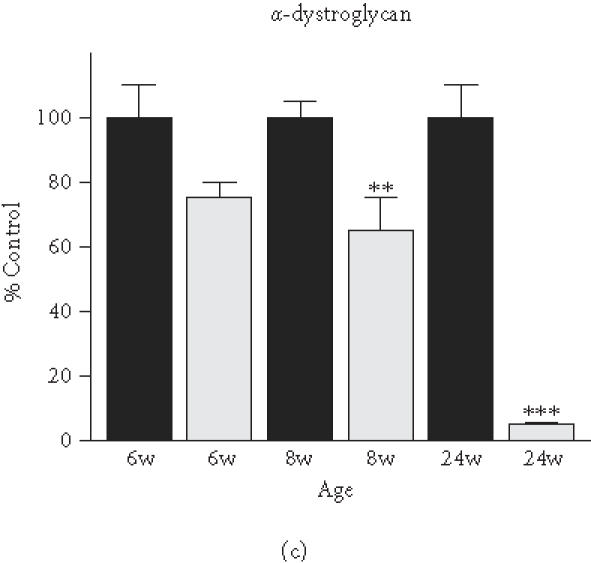
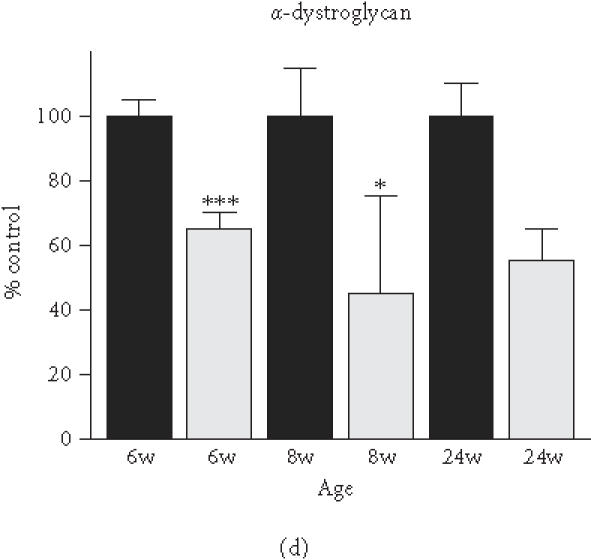
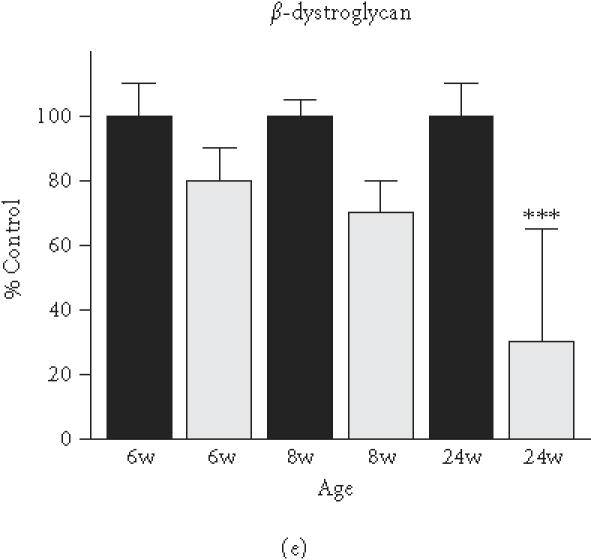
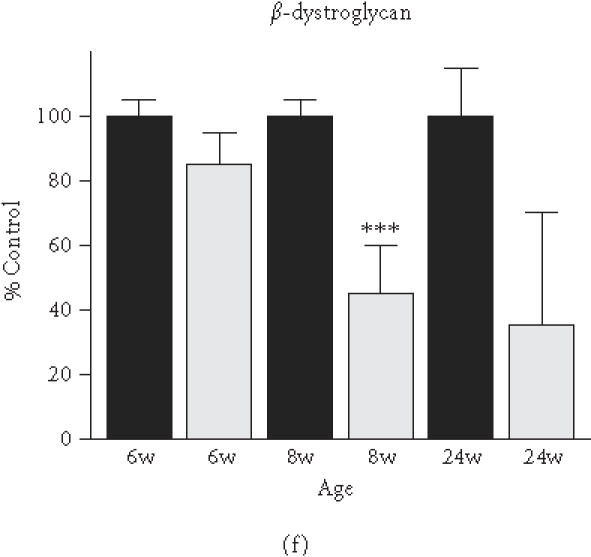
Comparative immunoblot analysis of dystroglycan expression in dystrophic heart and skeletal muscle. Shown is the graphical presentation of the immuno-decoration of laminin ((a),(b)), α-dystroglycan ((c),(d)), and β-dystroglycan ((e),(f)) in normal (black bars) and dystrophic mdx (grey bars) membrane preparations from both skeletal ((a),(c),(e)) and cardiac ((b),(d),(f)) muscles (n = 5; SEM; *P < .05; **P < .01; ***P < .001). Specimens were taken from 6-, 8-, and 24-week-(w-)old mice.
