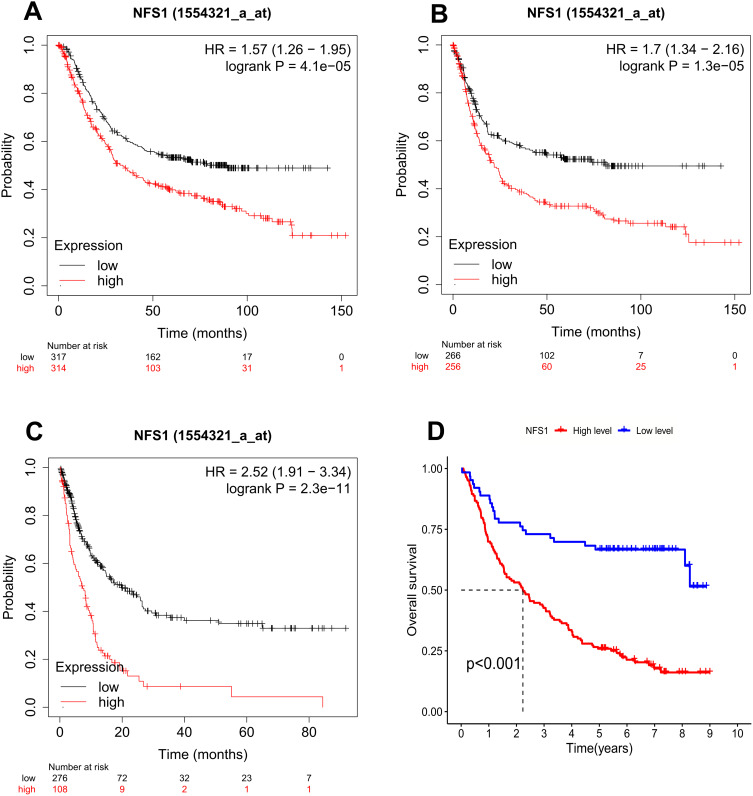
Figure 2.
Kaplan–Meier curves were estimated for the survival distributions in GC. (A-C) OS, FP, and PPS were expressed using Kaplan–Meier survival curves. (D) Kaplan– Meier plots of the high- and low-NFS1 expression GC patients from our cohort.
Abbreviations: OS, overall survival; FP, first progression; PPS, post-progression survival.

