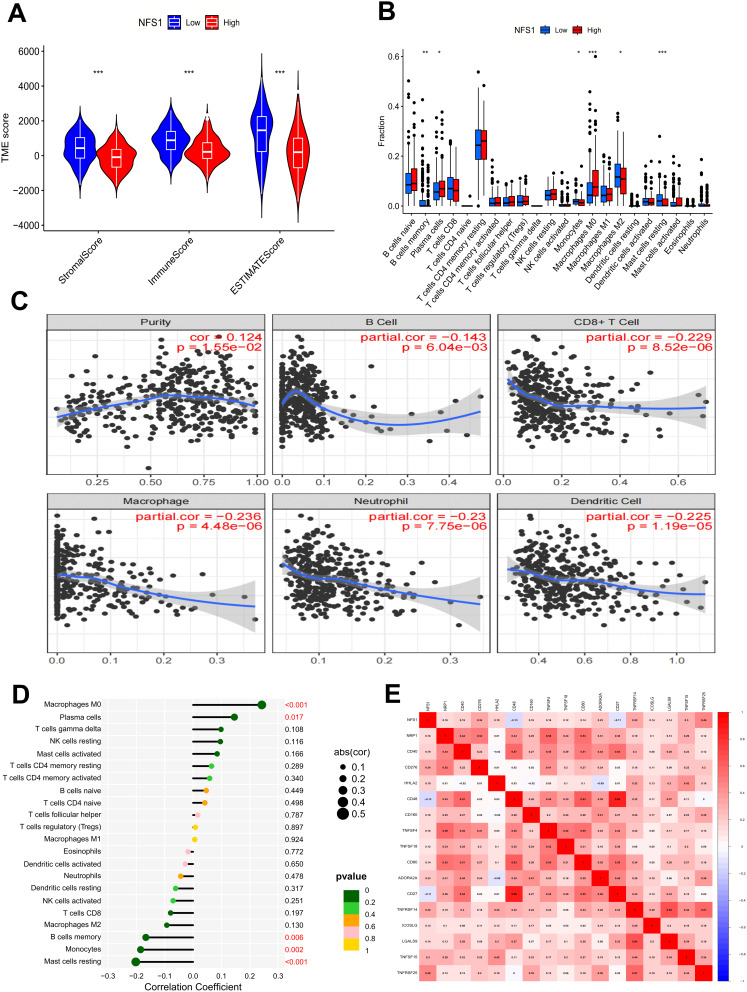
Figure 4.
NFS1 relates to TME and immune cell infiltration. (A) Analysis of differences in TME scores. (B) Analysis of differences in immune cells. (C) NFS1 expression is associated with immune cell infiltration in GC using the TIMER2.0 database. (D) Correlation analysis of immune cells and (E) Immune checkpoint *p < 0.05, **p < 0.01, ***p < 0.001.

