
Figure 1.
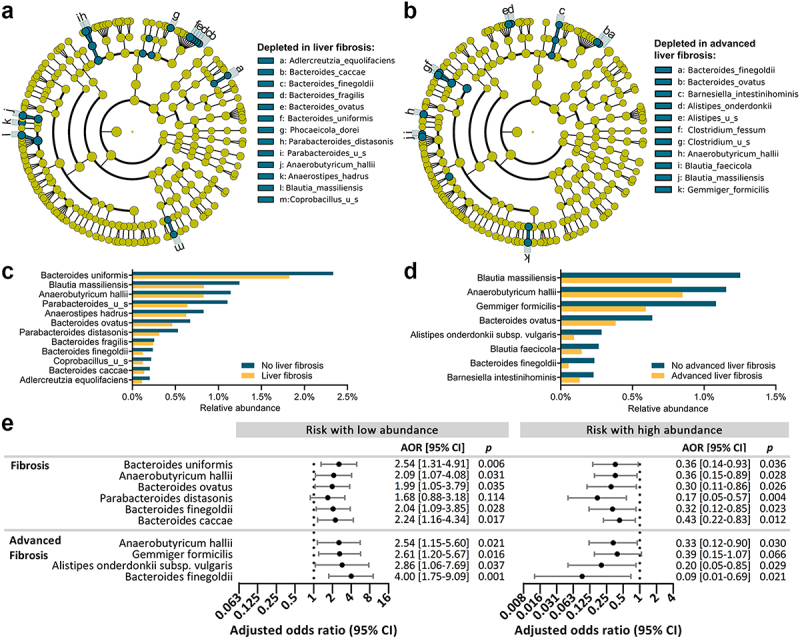
Bacterial species depleted in liver fibrosis or advanced liver fibrosis.
(a-b) Cladograms showing species significantly depleted (p<.05) in subjects with liver fibrosis (a) and advanced liver fibrosis (b). (c, d) Mean relative abundances of significant taxa in subjects with and without liver fibrosis (c) or advanced liver fibrosis (d). (e) Forest plots showing an increased risk of liver fibrosis or advanced liver fibrosis when species were at low abundance (left), and protective effect against liver fibrosis or advanced liver fibrosis when species were at high abundance (right). AORs are shown after adjusting for age and gender.