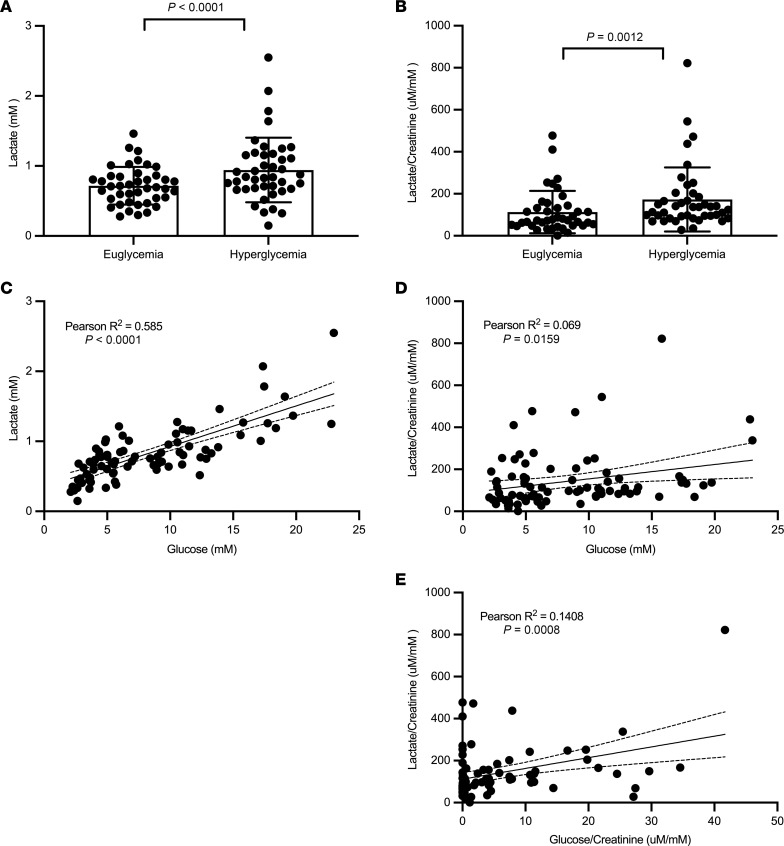
Figure 2. Urine lactate and plasma lactate increased with hyperglycemic clamp in T1D.
Patients with T1D (n = 40) and with no evidence of kidney disease were studied with a glycemic clamp to maintain blood glucose levels at a 4–6 mM range or in a hyperglycemic range (9–11 mM). (A and B) The changes in plasma and urine lactate/creatinine are demonstrated following the euglycemic and hyperglycemic clamps. P values in panels A and B were calculated by Wilcoxon matched-pairs signed rank test. (C and D) Both plasma and urine lactate are correlated with plasma glucose. (E) Urine lactate is correlated with urine glucose. Correlation analyses were performed using the Pearson’s correlation coefficient. Data represent mean ± SD.

