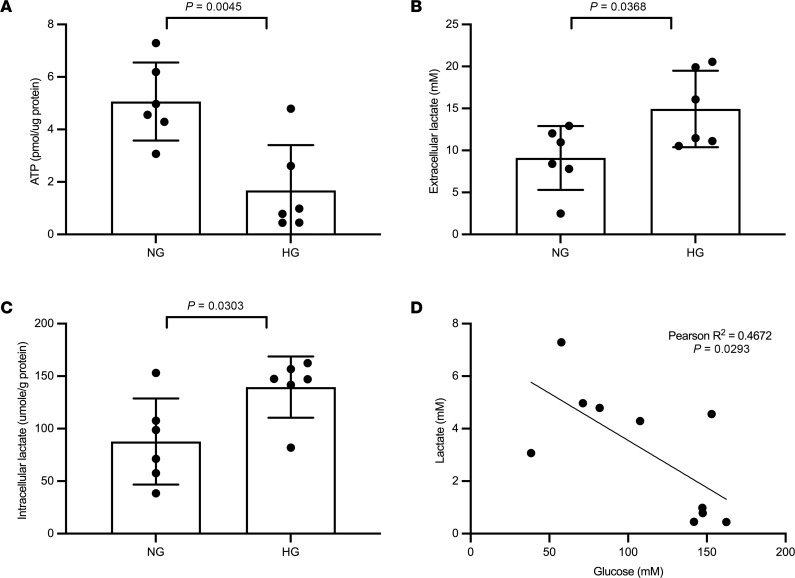
Figure 6. ATP production and intracellular lactate accumulation in isolated kidney sections.
(A–C) Kidney sections (n = 5–6 each group) from 10- to 12-week-old male C57BL/6J mice were incubated with normal glucose (NG) and high glucose (HG) for 24 hours to measure the ATP level (A), extracellular lactate (B), and intracellular lactate (C). (D) The ATP level negatively correlates with intracellular lactate (n = 10). Two-tailed t test in A–C and simple linear regression analysis in D using the Pearson’s correlation coefficient were performed for the statistical analyses. Data represent mean ± SD.

