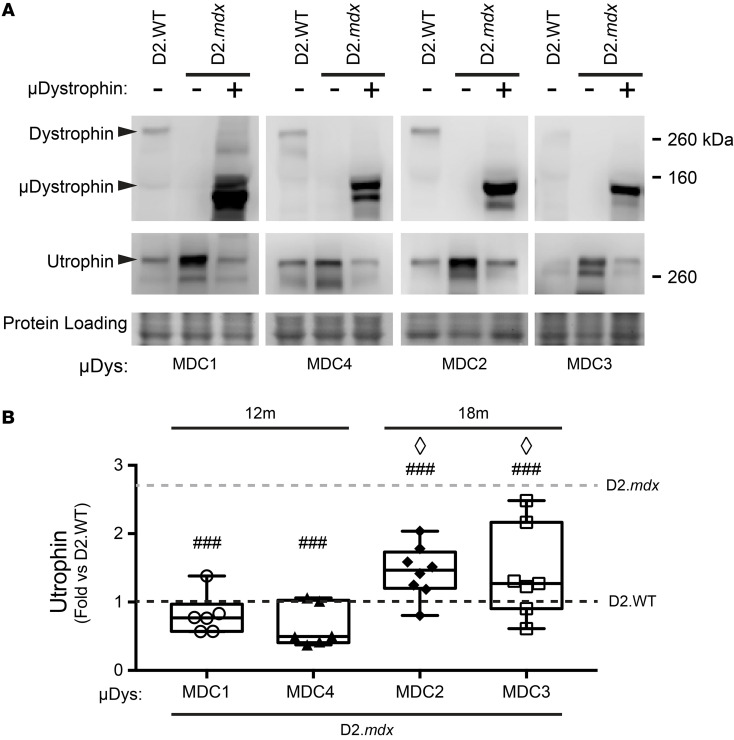
Figure 5. Diminution of sarcolemmal utrophin in microdystrophin overexpressing hearts.
(A) Western blots of plasma membrane-enriched heart samples reveal an approximately 2- to 3-fold upregulation of membrane-associated utrophin in D2.mdx (n = 16, gray dotted line). (B) This increased membrane-associated utrophin was normalized to D2.WT levels (black dotted line) in the heart upon AAV-mediated overexpression of MDC2 (n = 8) or MDC4 (n = 7) and even reduced to approximately 60% of the D2.WTs upon over-expression of MDC1 (n = 6) or MDC4 (n = 6) (1-way ANOVA; ###P < 0.001 versus D2.mdx, ◊P < 0.05 versus D2.mdx + MDC4, Tukey post hoc comparison). Box-and-Whisker plots represent minimum-to-maximum, with second and third quartiles within the box and a line that indicates the mean.

