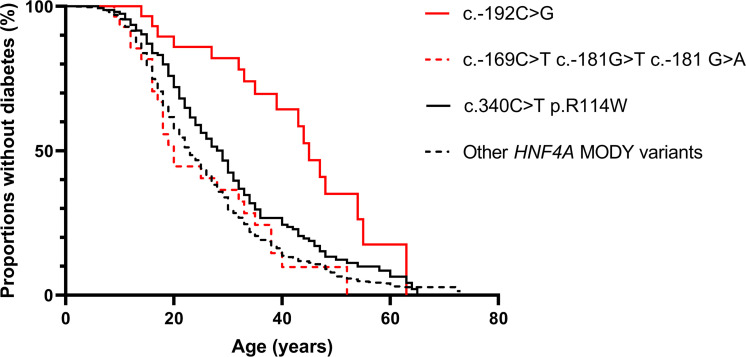
Figure 2. Kaplan-Meier plot demonstrating proportions of mutation carriers without diabetes at different ages for different HNF4A variants.
Red lines represent P2-HNF4A promotor variants, while black lines represent coding variants in HNF4A. P2-HNF4A promotor variants within the HNF-1A binding site are merged into 1 group, as are all coding variants in HNF4A with the exception of the low-penetrance variant c.340C>T (31).

