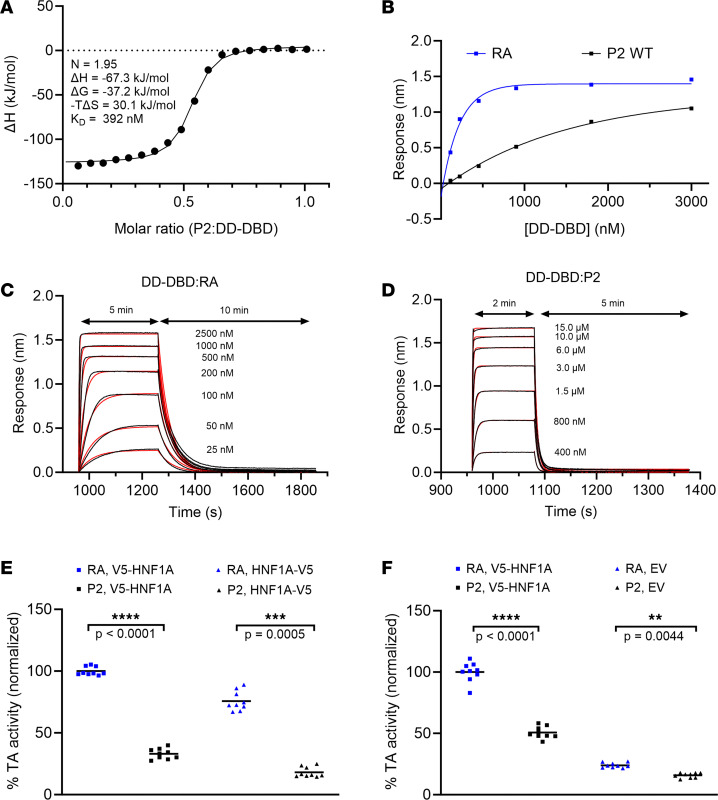
Figure 3. Biochemical and functional characterization of the HNF-1A:P2 interaction.
(A) ITC titration of 50 μM DD-DBD with 250 μM P2 oligonucleotide. (B) Response curves from BLI measurements of DD-DBD:RA and DD-DBD:P2 interactions. Measurement series 1 is shown representatively. (C and D) Association and dissociation traces of DD-DBD:RA (C) and DD-DBD:P2 (D) binding. Raw traces and fits are shown in black and red, respectively. (E and F) Transactivation assay in HeLa (E) and MIN6 (F) cells. Normalized transcriptional activity of overexpressed V5-HNF-1A, HNF-1A-V5, or endogenous HNF-1A (when only an empty vector [EV] is transfected) toward the RA- or P2-controlled FL reporter gene. Individual data points are presented along with mean values. Significance levels used in nested 2-tailed t test analysis: **: P < 0.01; ***: P < 0.001; ****: P < 0.0001.

