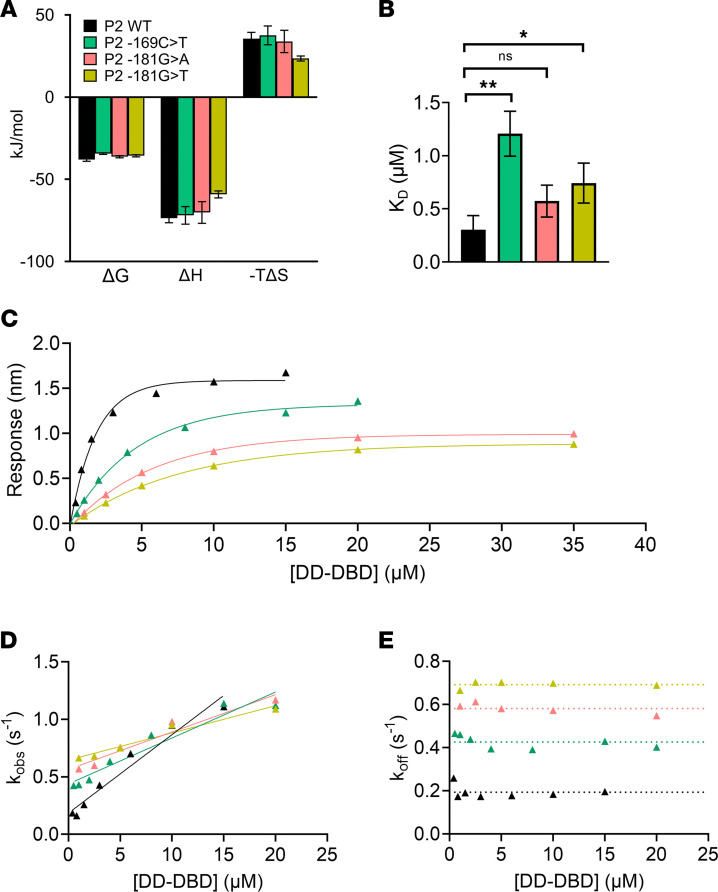
Figure 5. Thermodynamic and kinetic parameters of the DD-DBD:P2 WT and variant interactions.
(A) Thermodynamic analysis of the DD-DBD:P2 WT and variant interactions by ITC measurements. Measurements were done in technical triplicates (N = 3). (B) KD values extracted from ITC measurements in A. (C) BLI response curves for P2 WT (black), P2 -169C>T (green), P2 -181G>A (pink), and P2 -181G>T (yellow). (D) Observed rate constants (kobs), extracted from association reaction traces in BLI measurements. Data were fitted to a linear function f(x) = m x + n (solid line), for which m corresponds to the association rate (kon) noted in Table 4. (E) Dissociation rates (koff), extracted from dissociation reaction traces in BLI measurements. The average value across [DD-DBD] is represented as dotted line and corresponds to koff noted in Table 4. (C–E) Measurement series 1 is shown representatively. Coloring according to panel A. Significance levels used in unpaired 2-tailed t test with Welch’s correction: *: P < 0.05; **: P < 0.01.

