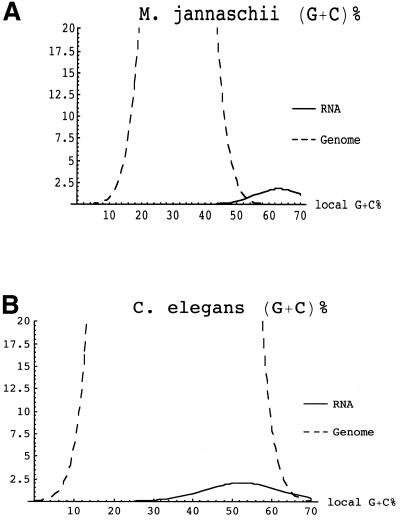
Figure 2.
Separation of RNAs and genomic background using G+C%. Vertical axes indicate estimated relative number of 100 bp subsequences. Note that the peak of the curve for the number of genomic sequences is truncated. RNA estimate assumes ratio of protein coding genes to ncRNA genes is approximately equal to that in S.cerevisiae. Graphs are shown as normally distributed for the purpose of illustration—the actual distribution of G+C% may vary. (A) M.jannaschii RNA and genome G+C% distributions are separated enough to enable discrimination between RNA and background populations. (B) C.elegans chromosome X. Although C.elegans ncRNA and genomic G+C% population means are significantly different, ncRNA distribution cannot be distinguished from that of the background by G+C% alone.

