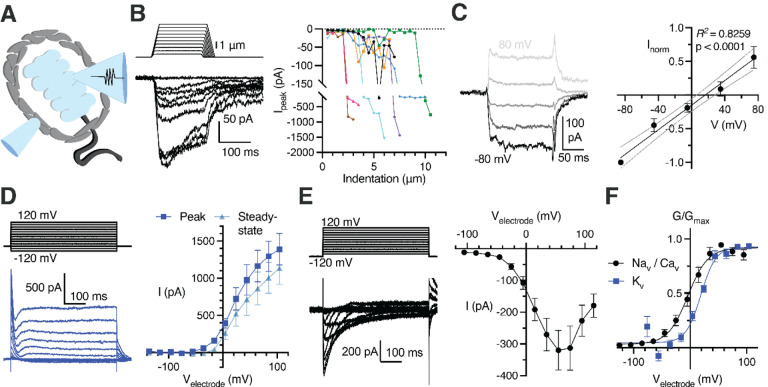
Figure 6. Lamellar Schwann cells are mechanosensitive and express voltage-gated ion channels.
(A) Illustration of a patch-clamped LSC with an indentation probe for mechanical stimulation
(B) Mechanical step stimuli (top left) and example voltage-clamp recordings (bottom left) from LSCs held at −80 mV, displaying inward mechanically activated (MA) current, and the summary of peak MA current vs. indentation depth in LSCs (right). Lines connect data from individual LSCs.
(C) Example MA current responses in a LSC voltage-clamped at −80, −40, 0, 40, and 80 mV and the current-voltage relationship (I-V curve) of MA current (mean ± SEM, n = 6 LSCs).
(D) The voltage step stimulus and an exemplar voltage-gated current response from an LSC with potassium-based internal solution, displaying heterogenous outward voltage-gated current (Kv current) (left) and the I-V curve of the Kv current measured at peak or steady-state phase of the current (right). Data shown as mean ± SEM from 11 recordings.
(E) The voltage step stimulus and an exemplar voltage-gated current response from an LSC with cesium-based internal solution, displaying inward, inactivating voltage-gated current (Nav or Cav current) (left) and the I-V curve of the inward voltage-gated current (right). Data shown as mean ± SEM from 10 recordings.
(F) Conductance-voltage relationship of the NaV/CaV and KV current, fitted with the Boltzmann equation. Data shown as mean ± SEM from 10 Nav/Cav and 11 Kv recordings.

