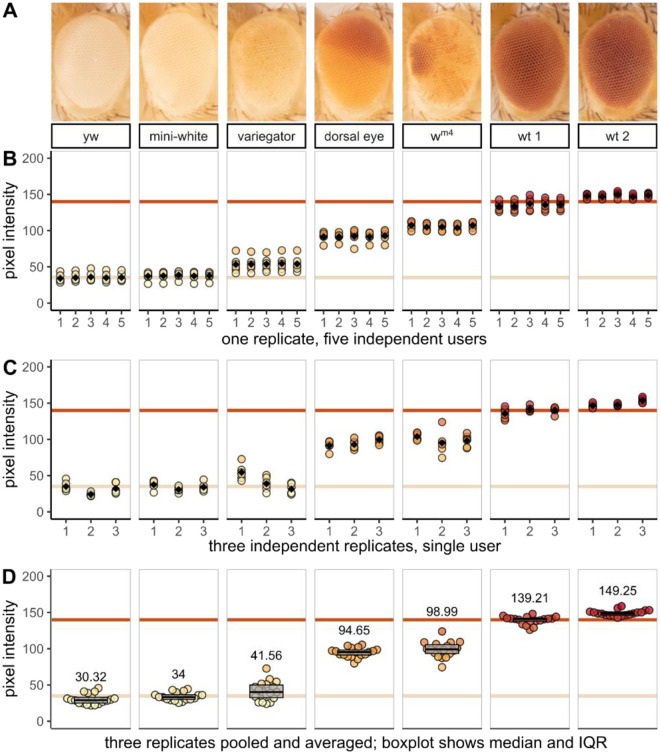
Figure 4.
Morphometric analysis of eye pigment data demonstrates precision, accuracy, and reproducibility. Female yw flies were crossed with males from one of seven fly stocks with different eye color phenotypes. Three independent biological replicates were collected for analysis. (A) representative 5x magnification images of each stock or genotype in this study; (B–D) quantitative data extracted from experimental images. Each filled circle represents the mean pixel intensity of one eye; the beige and red horizontal lines denote the average pixel intensity value for white and wild-type stocks respectively. Black diamonds in (A) and (B) and numerical values in (C) represent the group means. Boxplots in (C) show interquartile range with the median as a black horizontal line.

