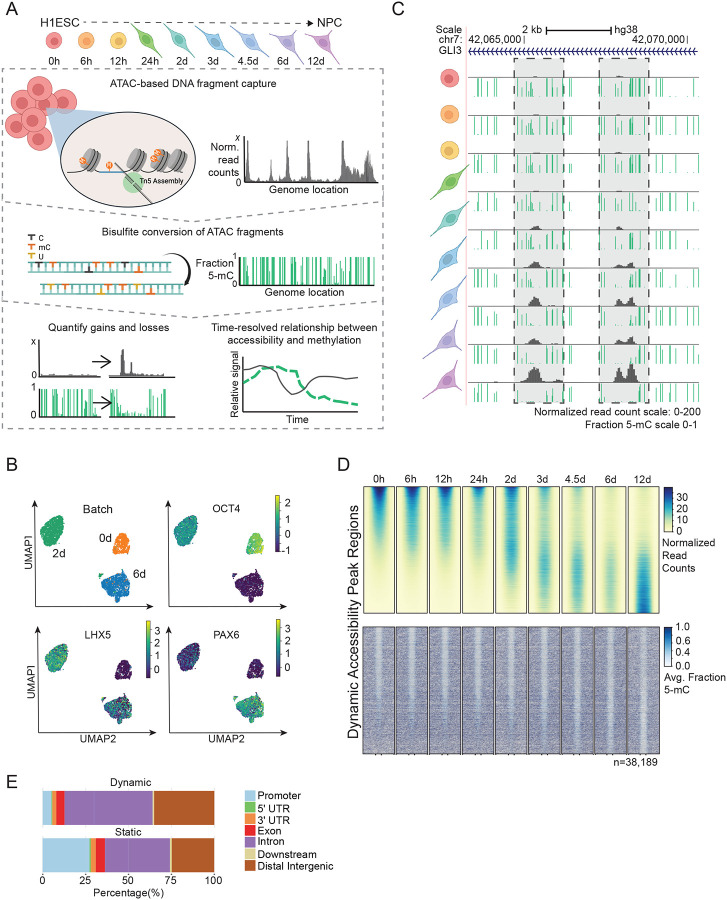
Figure 1: Directed differentiation of HESCs to NPCs displays extensive DNA demethylation within chromatin accessibility loci.
(A) The experimental design of ATAC-Me consists of four main steps. HESCs are differentiated to NPCs for 12 days and samples are taken at nine time points throughout the differentiation process. DNA fragments are isolated from Tn5 accessible chromatin followed by sodium bisulfite conversion to quantify methylation state of open chromatin regions. Analysis of resulting data captures dynamic behaviors of DNAme and ChrAcc over time. (B) UMAPs of single cell RNA-seq data for samples analyzed at 0, 2 and 6 days of differentiation. Groups (Batches) segregate according to timepoint and homogeneously express markers of ESCs (OCT4), intermediate NPCs (LHX5), and differentiated NPCs (PAX6). Marker gene overlays are scaled by normalized and transformed read count values. (C) UCSC Genome Browser tracks display ATAC-Me derived DNAme and ChrAcc measurements at the GLI3 locus. Grey boxes highlight two regions that gain accessibility and lose DNAme. The fraction methylated reads at each CpG site is represented by the height of the green bar. Accessibility is represented by normalized read counts shown in grey. Both tracks are merged signal of two replicates. (D) Heatmaps display the ChrAcc and DNAme signal of all dynamic ChrAcc peaks at each time point. Regions are sorted by decreasing normalized read count signal intensity at the 0-hour time point. Regions are scaled to 500 bp and plotted along the center of each +/− 0.5 kilobases and 1 kilobases for ChrAcc and DNAme, respectively. (E) Proportion of dynamic (n=38,189) and static (n=63026) regions annotated to genomic region classes is shown. Related to Figure S1.

