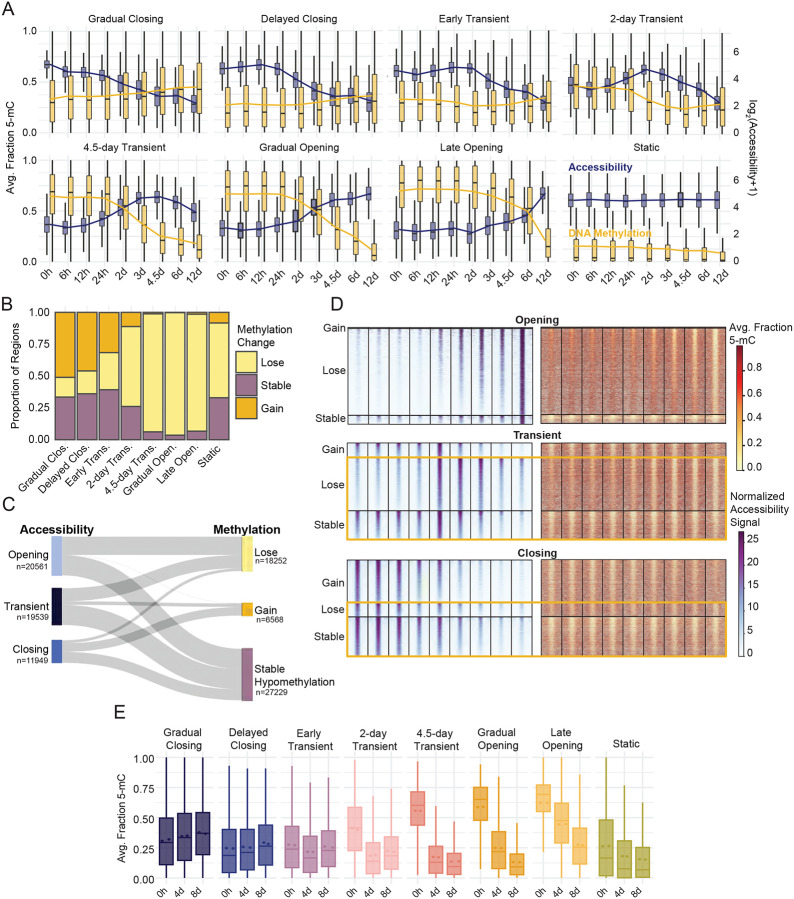
Figure 3: DNAme dynamics are unidirectional and temporally discordant with chromatin accessibility.
(A) Dual-axis boxplots of accessibility signal distribution (normalized read counts, blue) for each timepoint grouped by dynamic TCseq clusters. A pseudocount is added and the displayed data is log transformed for display. The corresponding average fraction methylation distribution across each region group and timepoint is shown in gold. The boxplots display the median of the signal distribution, and the line overlay represents the average signal at each timepoint. (B) The proportion of regions within each accessibility cluster that experience a gain, loss or no change in methylation over time. Regions were grouped based on the change of average regional methylation values over the entire time course, 0 to 12 days. The stable methylation group represents those regions which showed a change less than 10% between the 0 hour and 12-day time point. Methylation classification of “lose” or “gain” indicates a change of at least 10% in the average methylation between the 0 hour and 12-day timepoints in either direction. (C) The temporal relationship between accessibility and methylation behaviors represented by a Sankey plot. Accessibility subgroups represent dynamic regions from all TCseq clusters. Clusters were grouped by their dominant accessibility trend (i.e., opening, transient and closing) while the methylation classification from (B) was maintained. (D) Regional methylation and accessibility are displayed for all dynamic accessible regions. Heatmaps are grouped by accessibility subgroup then methylation behavior, the methylation classification from (B) was maintained. Yellow boxes highlight regions which display discordant epigenetic states by the end of the time course. (E) Average fraction DNAme values determined by whole genome 6-base sequencing across regions contained in each ChrAcc cluster are shown. 6-base sequencing was performed on samples collected at 0, 4, and 8 days of differentiation. Regional methylation values represent the average fraction methylation from two biological replicates. Related to Figure S3.

