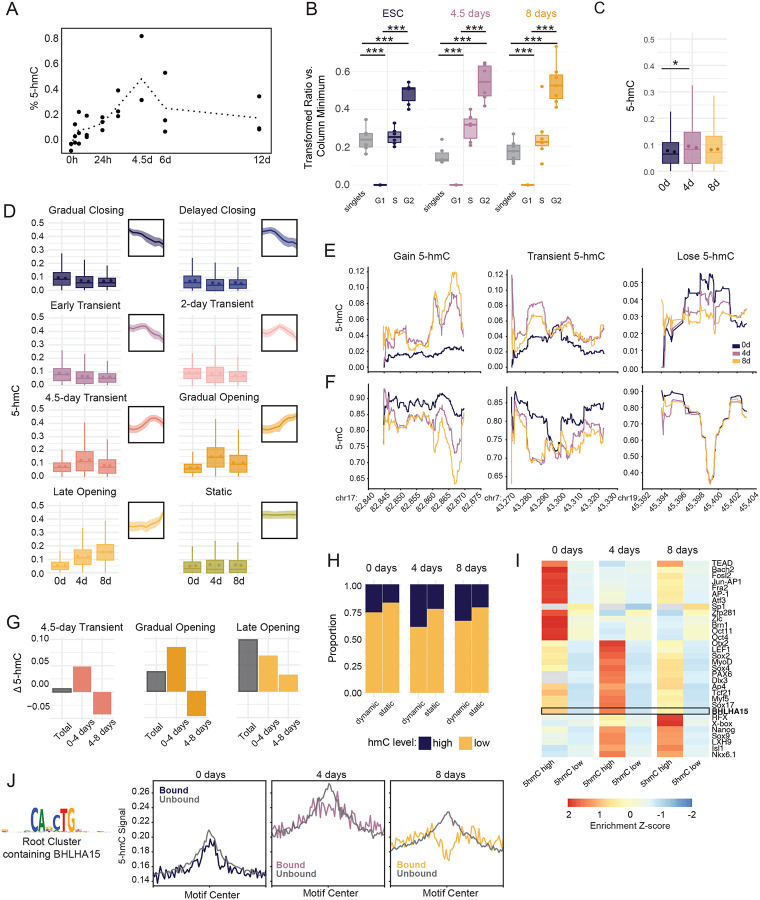
Figure 5: Early and sustained accumulation of 5-hmC demarcates demethylation timing at lineage specifying enhancers.
(A) Dotted line plot shows the average global %5-hmC of biological replicates measured by ELISA at nine timepoints. Individual biological replicates are shown as black dots. Each biological replicate is the average of two technical replicates. % 5-hmC is determined via standard curve. (B) Boxplots display the distribution of 5-hmC signal across cell cycle stages for each timepoint. 5-hmC was measured by immunostaining and flow cytometry and is displayed as a transformed ratio versus the minimum median signal intensity using Cytobank.98 The transformed ratio was calculated using the minimum within each sample group (timepoint, See Methods). Events were gated into cell cycle stage using PI/BrdU staining, which is shown in Figure S5B. ANOVA and Tukey HSD were used to compare 5-hmC across cell cycle stages (p-value <2e-16 for all comparisons). (C) Boxplots show average proportion 5-hmC (reads reporting 5-hmC/total reads) at CpG sites within dynamic accessible peaks at 2, 4, and 8 days. 5-hmC proportion was measured using whole genome 6-base sequencing for two biological replicates. The mean proportion 5-hmC of individual replicates is shown for each timepoint as colored dots, *, p= 0.0365, one-sided t-test. (D) Boxplots display the average proportion 5-hmC (reads reporting 5-hmC/total reads) of CpG sites across regions in each accessibility cluster. Individual biological replicate means are displayed as points within the boxplot. Thumbnail visualizations of accessibility signal for each cluster are displayed. (E) Representative traces for proportion 5-hmC and (F) proportion 5-mC at three genomic loci displaying different types of 5-hmC changes between the three time points. Chromosome and coordinates (x1,000) for each locus are printed below the plot. Proportion 5-hmC is calculated as the average number of reads reporting 5-hmC over the average total number of reads for two biological replicates. Proportion 5-mC is calculated as the average number of reads reporting 5-mC over the average total number of reads for two biological replicates. CpGs with coverage less than 15 reads over both replicates were excluded for this analysis. (G) The average change in proportion 5-hmC was calculated for ChrAcc regions in three representative dynamic ChrAcc clusters. “Total” represents the average difference between 8-day and 0-day timepoints, “0–4 days” represents the difference between 4-day and 0-day timepoints, and “4–8 days” represents the difference between 8-day and 4-day timepoints. (H) The proportion of static and dynamic ChrAcc regions with high or low 5-hmC within at each 6-base timepoint. Regions with an average fraction 5-hmC ≥ 0.106 (top 25% of regional 5-hmC fractions) across replicates were termed “high” and regions with an average fraction 5-hmC < 0.106 across replicates were termed “low”. (I) Heatmap displaying motif enrichment for 5-hmC high and 5-hmC low regions at each timepoint. Motif enrichment is displayed as the fold-change over background and is scaled by TF across each row. Grey boxes represent values that were not significant (>0.05) at the respective timepoint. The boxed row represents the motif enrichment for BHLHA15 which is selectively enriched in regions with high 5-hmC at 4 days. (J) Aggregate profiles display 5-hmC signal at TF footprints for the JASPAR root cluster containing BHLHA15 (shown to the left). TF footprinting and binding state designation was performed using TOBIAS. Profiles display signal at footprint sites with a flanking distance of +/−1000bp. Signal is binned into 25bp bins. Related to Figure S5.

