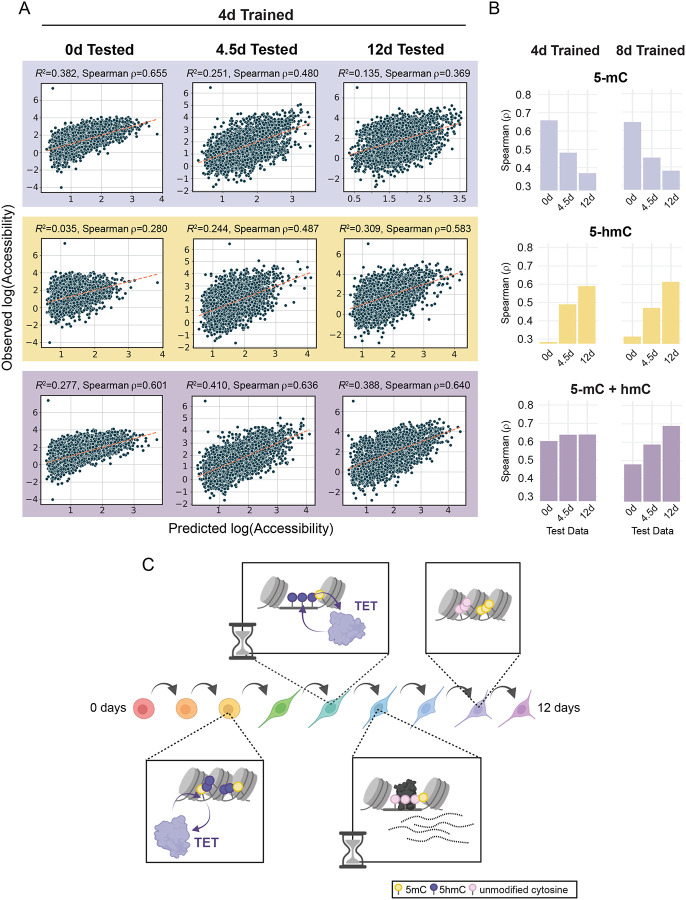
Figure 6: Chromatin accessibility prediction by machine learning.
(A) Scatter plots display the observed accessibility versus the predicted accessibility for machine learning models trained on 4-day 5-hmC and 5-mC data (5-mC alone, 5-hmC alone, and 5-mC + 5-hmC). XGBoost models were trained on dynamic ChrAcc regions (excluding regions on chromosome 1) using methylation data from each singular timepoint (0, 4, and 8 days) and tested on regions from chromosome 1 at each timepoint. The spearman correlation coefficient is shown for each model. Dotted lines are defined by the slope between the points [minimum predicted value, minimum predicted value] and [maximum predicted value, maximum predicted value] in each scatterplot. (B) Bar plots of spearman ρ values (predicted vs. observed accessibility) for dynamic accessibility region models trained on 4-day or 8-day trained methylation data. Models were tested on all three timepoints in a similar fashion to those in A. Plots are divided by which methylation states were used for fitting. (C) A representative schematic of the molecular timeline proposed in this study. During the cell fate transitions that accompany NPC differentiation, enhancer regions that will be opened and activated first undergo 5-mC oxidation whereby 5-mC becomes 5-hmC (purple lollipops). This is followed by increases in accessibility and further oxidation, resulting in subsequent demethylation. TFs can bind these hydroxymethylated sites and facilitate the completion of demethylation while activating transcription of associated genes. Both the initial demethylation steps and the completion of the demethylation cycle are discretely timed events that occur between 2–6 days of differentiation. When an enhancer region is no longer required by the new cell fate, it loses TF binding and decreases in accessibility. However, the regions remain hypomethylated. Related to Figure S6.

