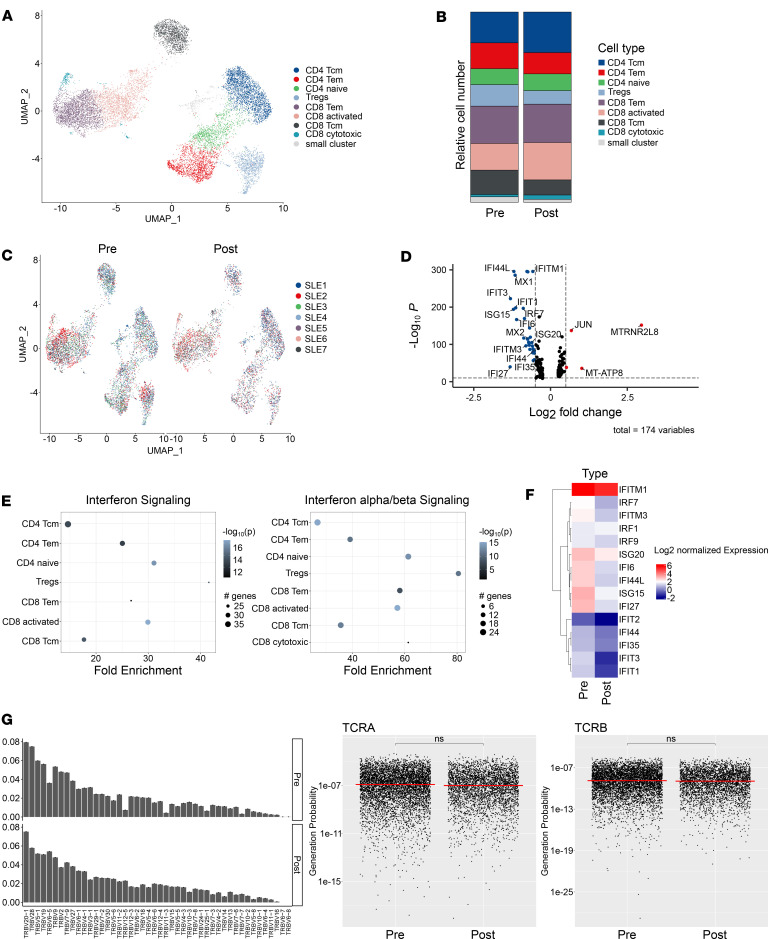
Figure 2. CD19 CAR T cell–mediated changes in T cell signature and TCR repertoire.
(A–C) scRNA-Seq–based reclustering and visualization of CD4+ and CD8+ T cells before and after CD19 CAR T cell treatment using dimensionality reduction on a 2D scale in a UMAP plot. (D and E) Volcano plot and pathway enrichment analysis showing the effect of CD19 CAR T cell treatment on the differential gene expression. (F) Heatmap displaying changes of IFN-dependent genes upon CD19 CAR T cell treatment. (G) scRNA-Seq–based T cell receptor repertoire analysis showing V gene usage of TCR-β chains and probability of TCR chain generation based on calculation with the OLGA algorithm. Statistical analyses were performed using the median and 1-tailed t test with Benjamini-Hochberg correction.

