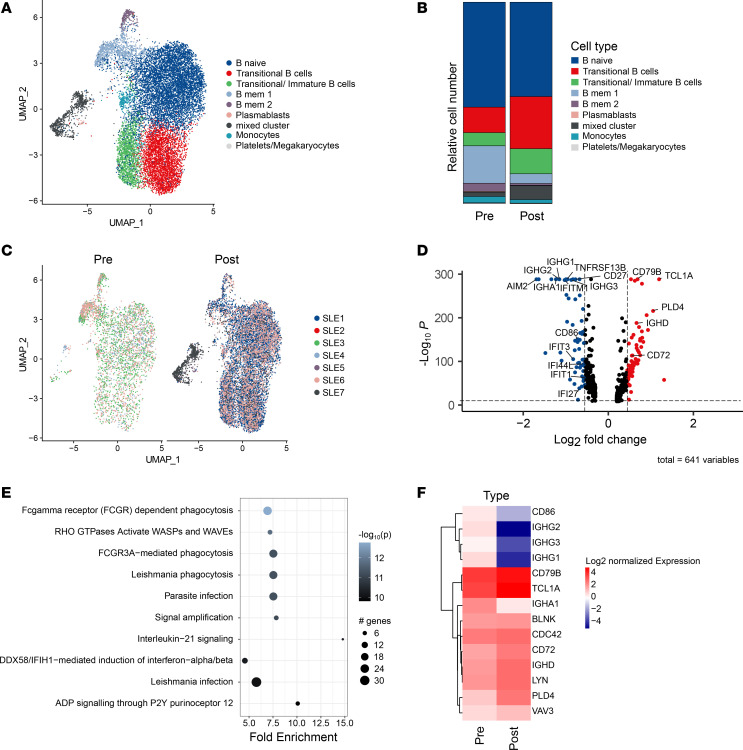
Figure 3. CD19 CAR T cell–mediated changes in B cell signature.
(A–F) scRNA-Seq–based analysis of data sets generated from sorted B cells before and after CD19 CAR T cell therapy illustrated as grouped individual UMAP plots (A and C) and calculated relative cell number of indicated B cell subsets (B); differential gene expression (D), gene expression-based pathway analysis (E), and expression of BCR and FcγR signaling related genes (F) in scRNA-Seq data sets derived from isolated B cells before and after CD19 CAR T cell therapy.

