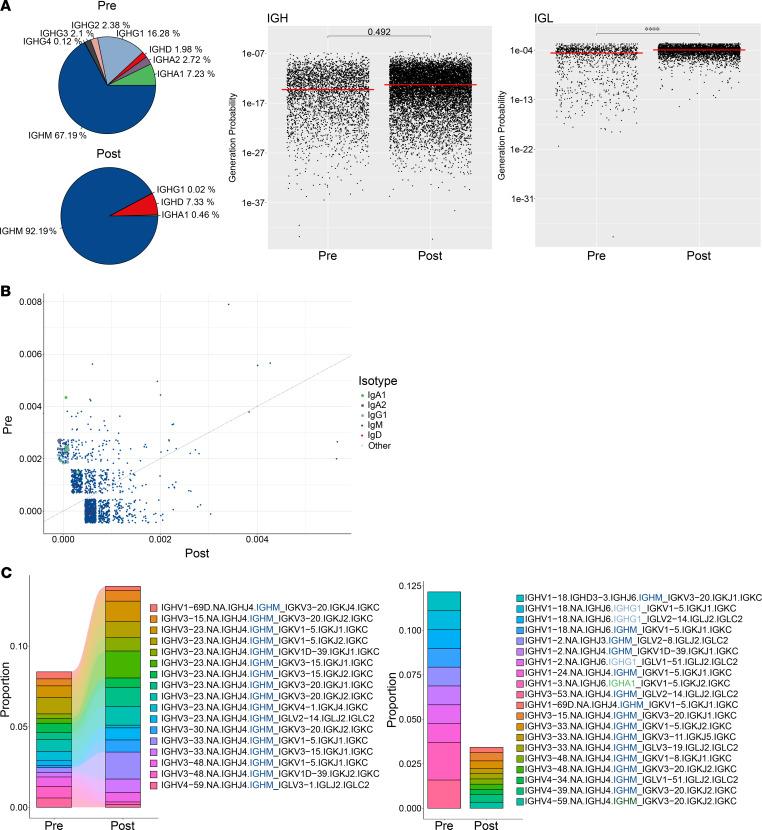
Figure 4. CD19 CAR T cell–mediated changes in B cell repertoire.
(A) BCR repertoire analysis demonstrating prevalence of Ig subclass distribution following CD19 CAR T cell treatment and the probability of generation of BCRs as calculated by the OLGA algorithm. (B) Comparison of expanded clones based on VDJ gene annotation before and after CD19 CAR T cell treatment. (C) Top 10 expanded clone analysis on their sharedness and repertoire proportion. Statistical analyses were performed using the median and t test with Benjamini-Hochberg correction. Significant differences are indicated as follows: ****P ≤ 0.0001.

