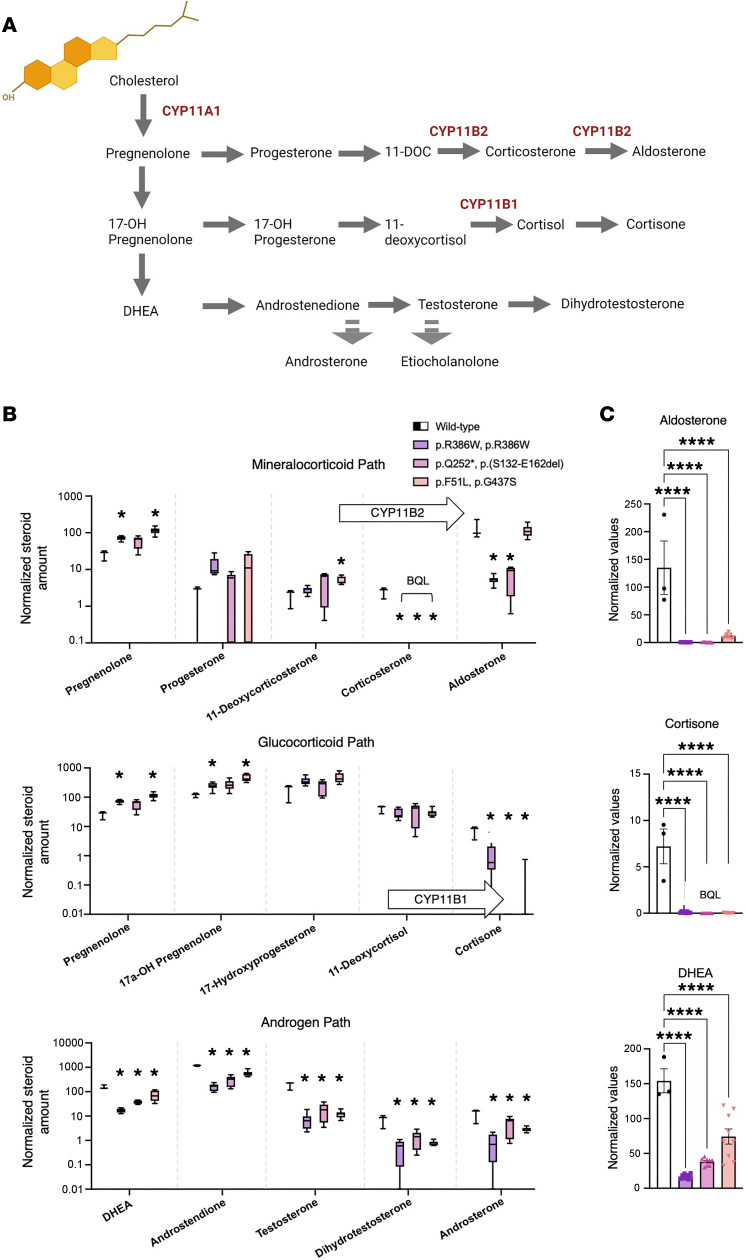
Figure 2. Cells from FDXR patient display low CYP11B1 and CYP11B2 enzymatic activity.
(A) Classical steroids and steroidogenic pathways, all initiated from cholesterol (top left), occurring in the human adrenal cortex. In red, the official names of the 3 FDXR-dependent mitochondrial steroidogenic enzymes, namely CYP11A1 (also known as Cholesterol side-chain cleavage enzyme), CYP11B2 (Aldosterone Synthase), and CYP11B1 (Steroid 11β-hydroxylase). (B) Steroid amounts in culture media conditioned by reprogrammed fibroblasts from FDXR patients compared with control values (representing steroid amounts in culture media conditioned by reprogrammed fibroblasts from a single nonaffected individual; i.e., Control). Steroids are split among 3 graphs according to their belonging to a specific steroid class. Arrows containing the names of enzymes indicate the enzymatic reaction carried out by the enzyme. Asterisks reflect discoveries found using a multiple unpaired t test assuming individual variance for each steroid. *P < 0.05. (C) The endpoint or most representative steroids for each pathway on the left, on a linear scale. Statistical analysis was conducted using a 1-way ANOVA followed by Dunnett’s multiple comparisons test. All values in B and C are normalized by GAPDH transcripts contained within the cell monolayer, used as a proxy for cell number, as reported in Supplemental Figure 1D. Below quantification level (BQL) indicates the samples in which steroid levels were not measurable above the lowest quantification limit using LC-MS. DHEA, Dehydroepiandrosterone; 11-DOC, 11-deoxycorticosterone. ****Padj < 0.0001.

