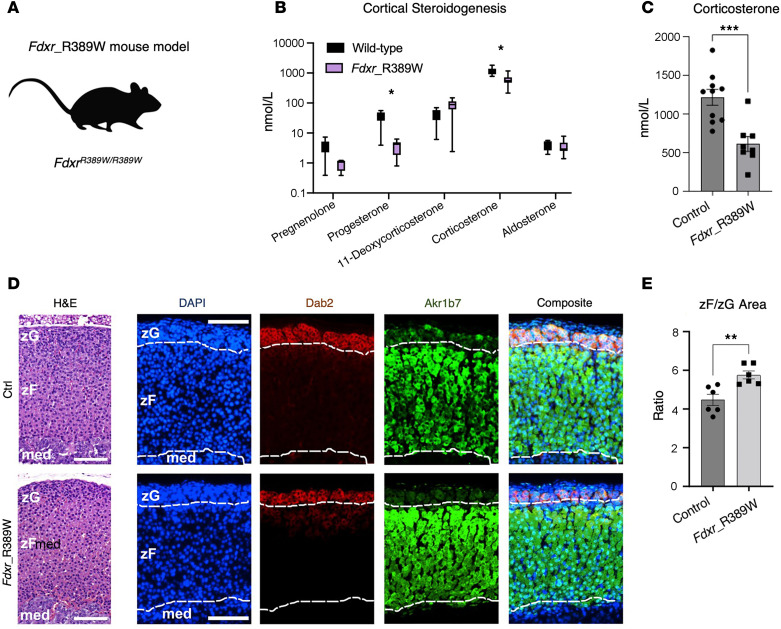
Figure 4. The FdxrR389W mouse model shows no impairment of adrenal structure and zonation.
(A) Schematic of the novel mouse model (FdxrR389W) carrying homozygous R389W mutations, allelic to the hotspot R386W variant in FDXR patients. (B) Serum steroid profile of the FdxrR389W mice compared with control animals. Asterisks reflect discoveries found using a multiple unpaired t test assuming individual variance for each steroid, with FDR, and a 2-stage step-up method (Benjamini, Krieger, and Yekutieli). *P < 0.01. (C) Serum levels of corticosterone, the main glucocorticoids in mice, in control and FdxrR389W mice. Significance was tested using an unpaired t test. (D) Micrographs of representative adrenal sections, either stained with H&E (left) or immunoassayed with Dab2 (zona glomerulosa, zG), Akr1b7 (zona fasciculata, zF), and DAPI (for nuclei; right panels). Scale bar: 200 μm. Dotted white lines outline the zG region as identified using Dab2 staining, and the corticomedullary (med) region (below) as marked by the lower boundary of the Akr1b7 staining. (E) Ratio values calculated as zF area normalized by zG area, measured on 6 independent entire adrenal coronal sections for either controls or FdxrR389W samples. An unpaired t test was used to calculate significance. **P < 0.01; ***P < 0.001.

