Fig 14.

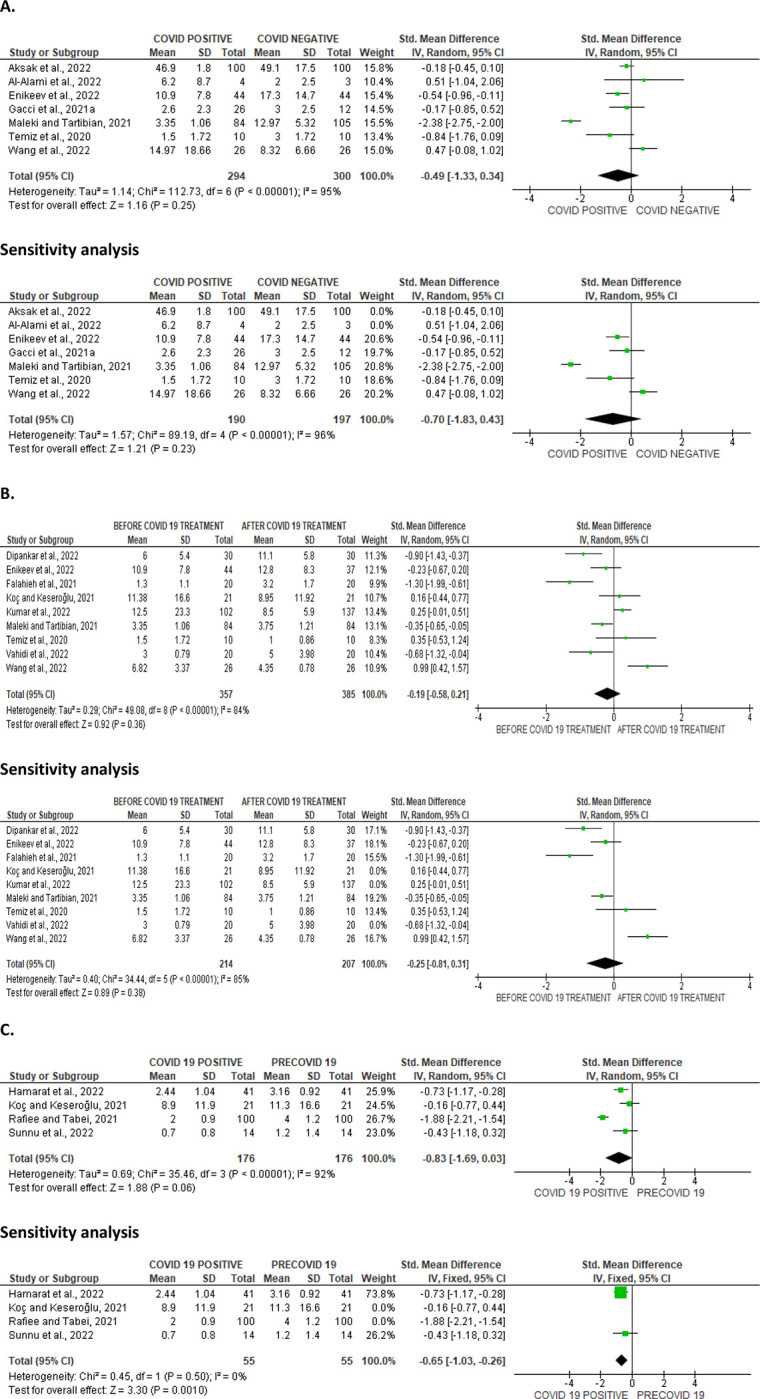
Forest plot of normal sperm morphology comparing between COVID-19 positive and COVID-19 negative patients (A), before COVID-19 treatment and after COVID-19 treatment (B), and COVID-19 positive and preCOVID-19 period (C).

Forest plot of normal sperm morphology comparing between COVID-19 positive and COVID-19 negative patients (A), before COVID-19 treatment and after COVID-19 treatment (B), and COVID-19 positive and preCOVID-19 period (C).