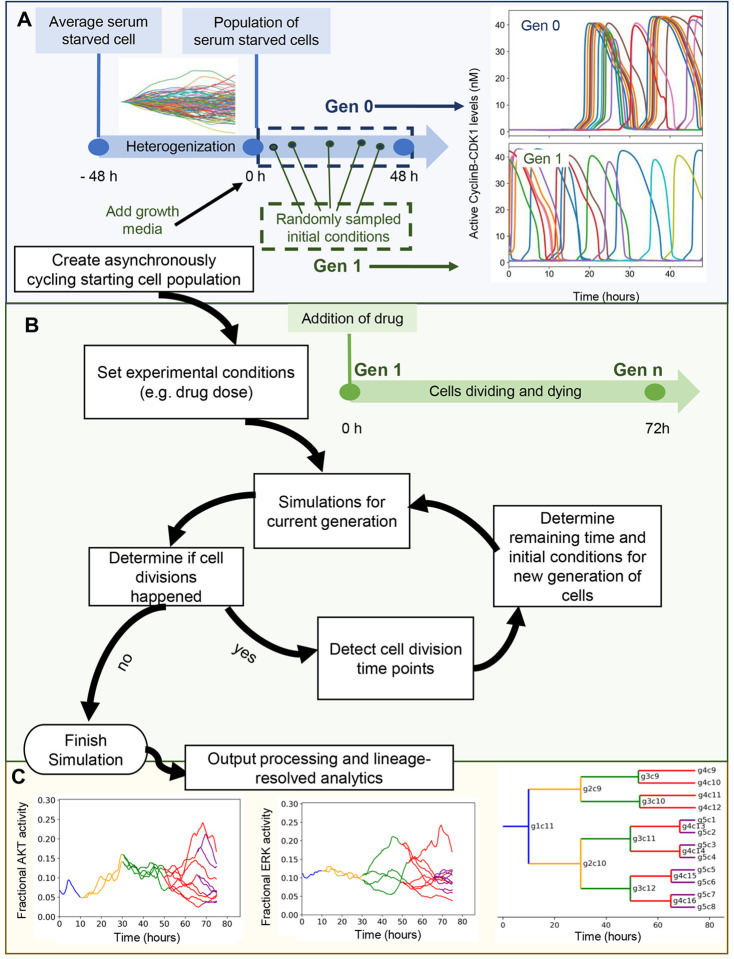
Figure 1. Workflow of the developed simulation algorithm.
A. An asynchronously cycling cell population (Gen 1) is initiated by sampling the initial conditions at random time points from a pool of single cell simulations run with growth factor stimulation (Gen 0). B. Upon the execution of each generation, detection of new cell division events (or lack thereof) within simulation time determines the creation or not of a next generation. C. (left and center) Cross-generational trajectory of observed ERK and AKT activity from a randomly-chosen single-cell lineage. Varying colors represent subsequent generations, starting from Gen 1. (right) In silico lineage tracing capability is demonstrated with a lineage dendrogram. Lines representing individual cells are labeled with generation and index.

