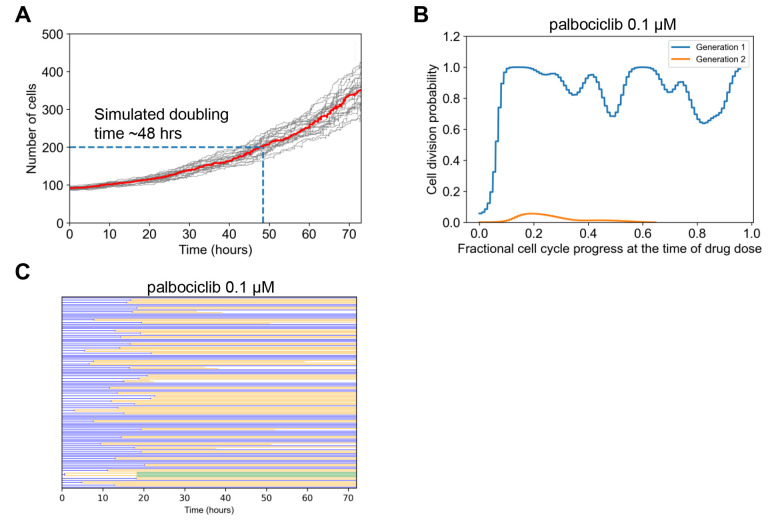
Figure 3. Simulation Analysis to Investigate Palbociclib Dose Response Discrepancy.
A. Simulated cell growth curves under control conditions for multiple replicates. The dark black line is the median which was used to estimate doubling time, when the initial cell number (100) doubled (200). B. The fractional progression through the cell cycle (see Methods) was estimated for the beginning 100 generation 1 cells. This was the point at which 0.1 μM palbociclib was administered. The division outcome for each cell was then determined for this current generation, and if it exists for the next generation. The probability of division occurring was empirically estimated from this collection of binary outcomes and then plotted. C. Cell lineage dendrogram for response to 0.1 μM palbociclib. Most cells divide once early, and then the response is cytostatic.

