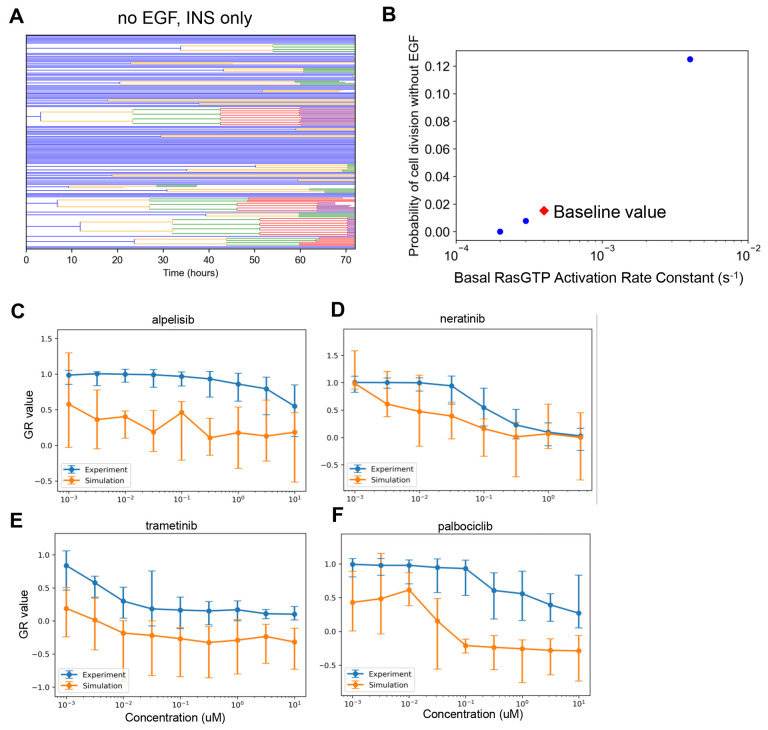
Figure 4. Simulation Analysis to Investigate Neratinib Dose Response Discrepancy.
A. Lineage dendrograms under control (no drug) conditions without EGF but with insulin. There are multiple rapidly dividing cells. B. Dependence of the probability of cell division as a function of the rate constant controlling basal Ras activation. Simulations were done as in A, without EGF and with insulin. The baseline value for the rate constant in the current published version of the model is designated by the red diamond. C-F. Dose response curves as in Figure 2, except with the altered basal RasGTP activation rate constant from panel B (2×10⁻⁴ s−1).

