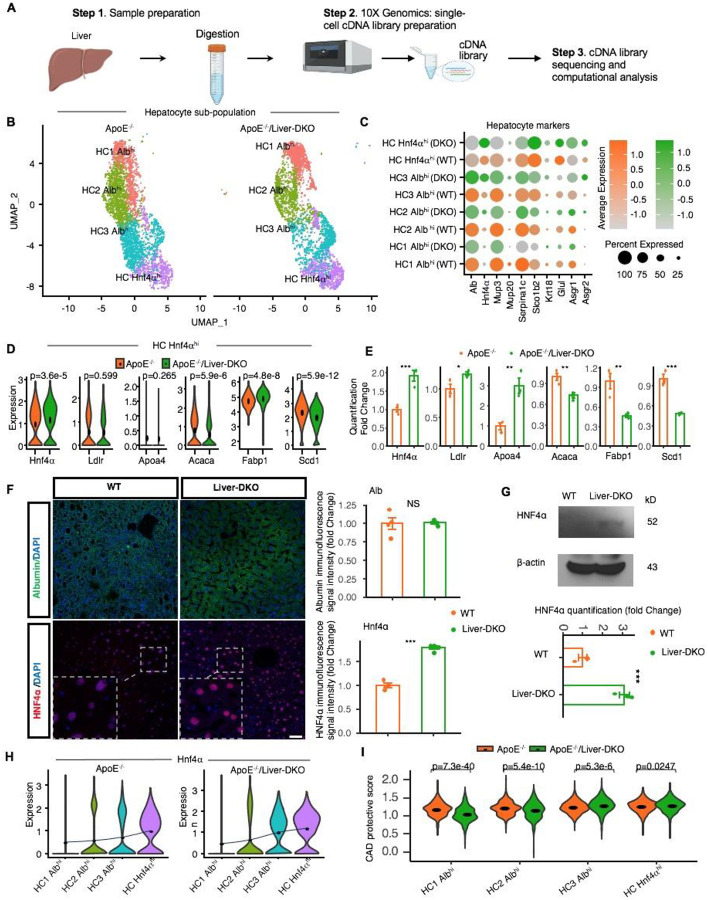
Fig. 1: Single-cell RNA-sequencing reveals gene expression dynamics in Liver-DKO mice on an ApoE−/− background.
A: Schematic representation of the single-cell RNA-sequencing (snRNA-seq) process performed on liver tissues from ApoE−/− and ApoE−/−/Liver-DKO mice. B: UMAP visualization illustrating the heterogeneity of hepatocyte cell populations indicating distinct clustering patterns of hepatocytes in ApoE−/−/Liver-DKO mice compared to ApoE−/− controls. C: Dot plot showing the expression of gene markers in respective sub-cell types. D-E: Elevated gene expression related to LDL particle clearance and decreased gene expression related to fatty acid synthesis in ApoE−/−/Liver-DKO as compared to ApoE−/−, shown through single-cell analysis (D) and real-time quantitative PCR (qPCR) (E). F: Elevated HNF4α expression level in Liver-DKO mice. Immunofluorescence stain of HNF4α, Albumin in the liver from both WT and Liver-DKO mice (left), HNF4α is in red color, Albumin is in green color (marker of hepatocytes), and DAPI is used for nuclei stain. Quantification of HNF4α immunofluorescence signal intensity between WT and Liver-DKO (right). G: Western blot of HNF4α for the liver lysates from WT and Liver-DKO, beta-Actin is used as internal reference (left), the quantification of HNF4α. H: Hnf4α expression increasing from HC1 Albhi to HC3 Albhi in both conditions ApoE−/− and ApoE−/−/Liver-DKO. I: Coronary artery disease (CAD) protective score comparing ApoE−/−/Liver-DKO to ApoE−/−. Note: We used the two-tailed t- test to compare the samples in panel (E). expression in both WT and Liver-DKO (right). n=3, **p<0.01, ***p<0.001.

