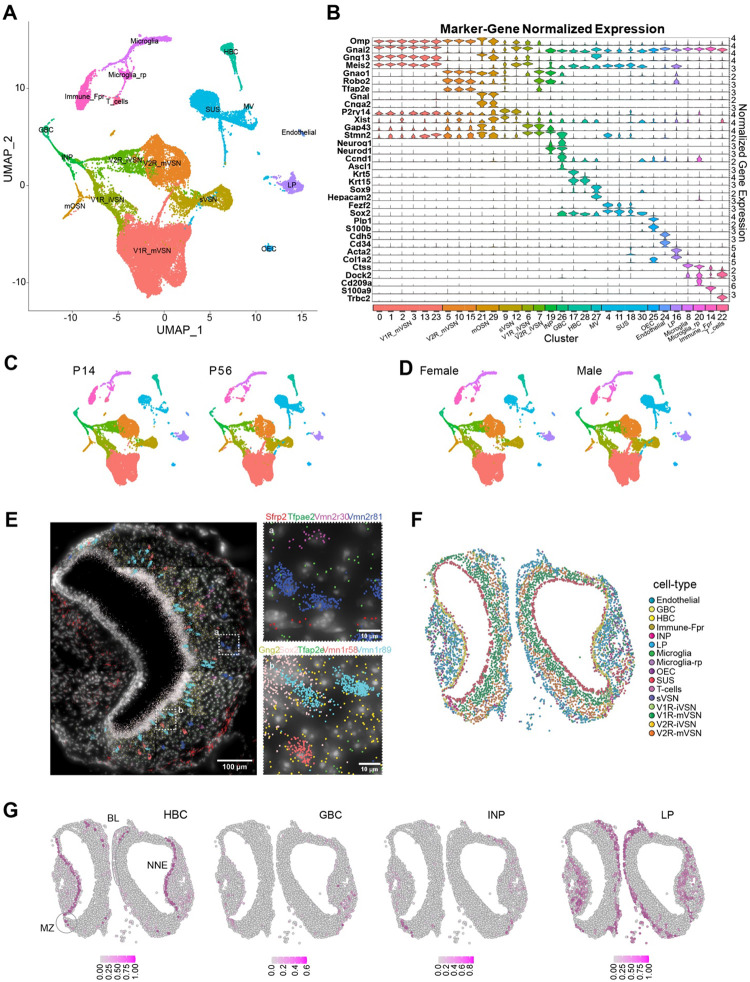
Fig. 1. Single cell transcriptomic profile of the whole vomeronasal organ.
A. UMAP visualization of integrated cell-type clusters for whole-VNO single-cell RNA-seq. B. Cell-type marker-gene normalized expression across the cell clusters. C. UMAP of cell-type clusters split by age. D. UMAP of cell-type clusters split by sex. E. A representative image of transcript distribution for 9 genes in a VNO slice using the Molecular Cartography© platform Resolve Biosciences. Insets (a and b) show the magnified image of areas identified in the main panel. Individual cell shapes can be determined from the transcript clouds. F. Spatial location of individual VNO cells color-coded according to cell type prediction based on the spatial transcriptomic analysis. G. Location of cell belonging to HBC, GBC, INP, and LP cell types, respectively. Heat indicates confidence of predicted values. BL: basal lamina; MZ: marginal zone.

