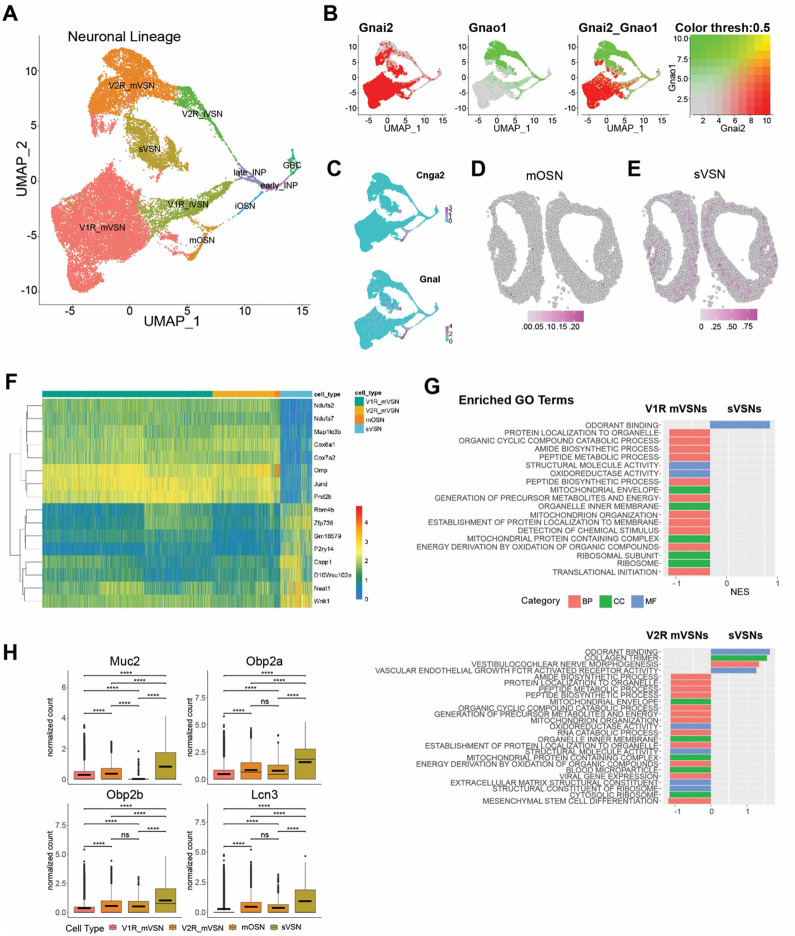
Fig. 2. Novel neuronal lineage.
A. UMAP visualization of cell-type clusters for the neuronal lineage. B. Expression of Gnai2 and Gnao1 in the neuronal lineage. C. Expression of Cnga2 and Gnal in the OSN lineage. D-E. Location of mOSNs (D) and sVSNs (E) in a VNO slice. Color indicates prediction confidence. F. Heatmap of normalized expression for a select set of mutually differentially expressed genes between sVSNs and mature V1Rs, V2Rs, and OSNs. G. Enriched gene ontology (GO) terms in sVSNs when compared with V1R and V2R VSNs, respectively. H. Box plots of normalized expression for Muc2, Obp2a, Obp2b, and Lcn3 across mature sensory neurons.

