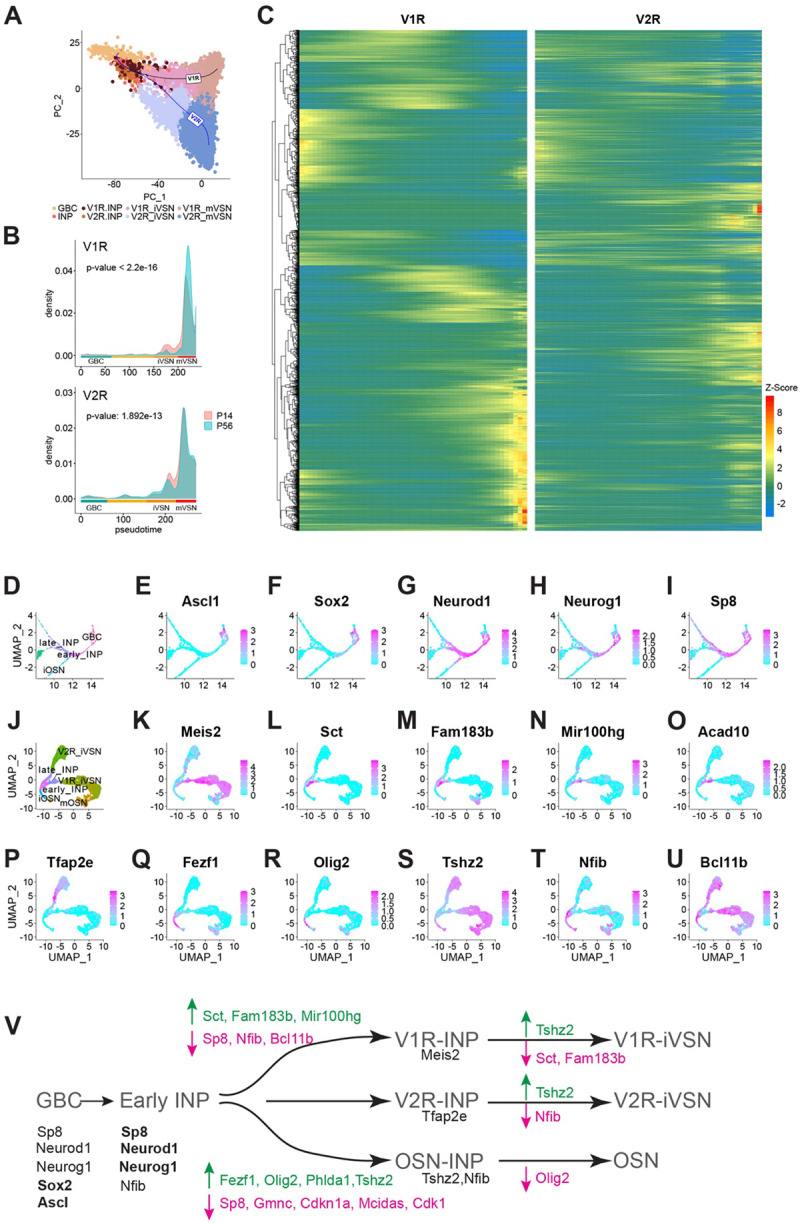
Fig. 3. Molecular cascades separating the neuronal lineages.

A. PCA plot of V1R and V2R pseudotime principal curves across cell types. B. Cell density plots across pseudotime for P14 and P56 mice. C. Heatmap showing expression in pseudotime for genes that differentially expressed between the V1R and V2R lineages. Heat indicates Z-score values. D. Zoomed in UMAP of cell types early in the neuronal lineage. E-I. Feature plots for select genes expressed early in the neuronal lineage. J. UMAP of INP, iVSN, iOSN, and mOSN cell types. K-U. Normalized expression of candidate genes for V1R/V2R/OSN lineage determination. V. A simplified model for lineage determination by transcription factors in VNO sensory neurons.
