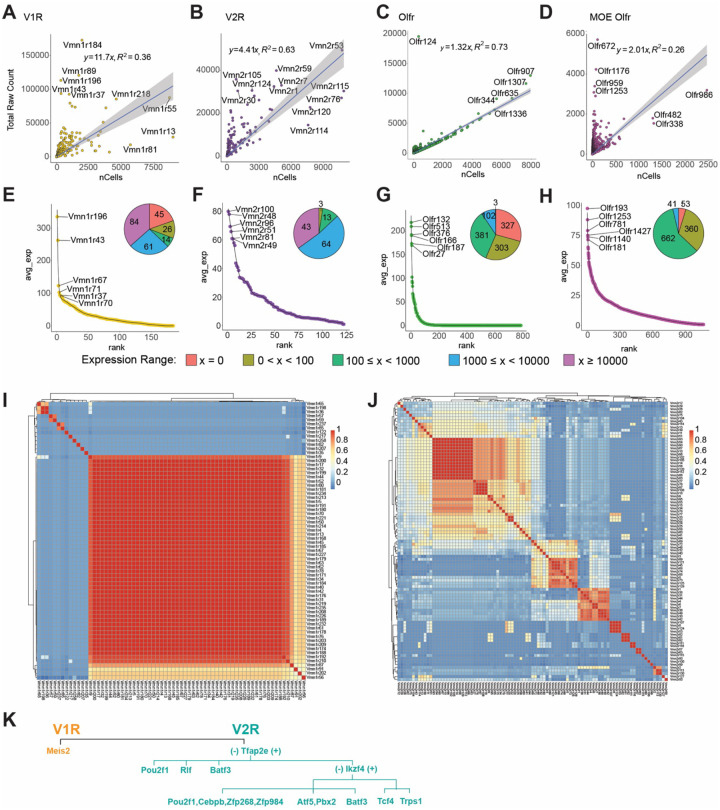
Fig. 4. Receptor expression in the VNO.
A-D. Expression level of individual receptor (total raw counts) plot against the number of cells expressing the receptor for V1R (A), V2R (B), VNO-Olfr (C), and MOE-Olfr (D). E-H. Ranked distribution of average expression per cell for the four receptor classes. Inset pie charts show the number of cells expressing a receptor at the specified range. I and J. Heatmaps showing the correlation of transcription factor expression among the V1Rs (I) or V2Rs (J). K. A simplified model of transcription factor selection in mVSNs.

