Figure 3.

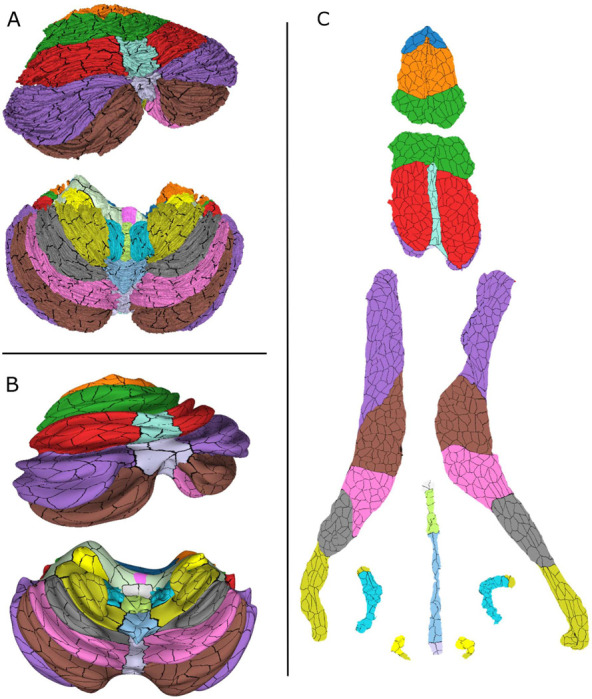
Surface atlas with parcellation borders marked as black in different representations: normal (A), inflated (B) and flat (C).

Surface atlas with parcellation borders marked as black in different representations: normal (A), inflated (B) and flat (C).